GET Cities
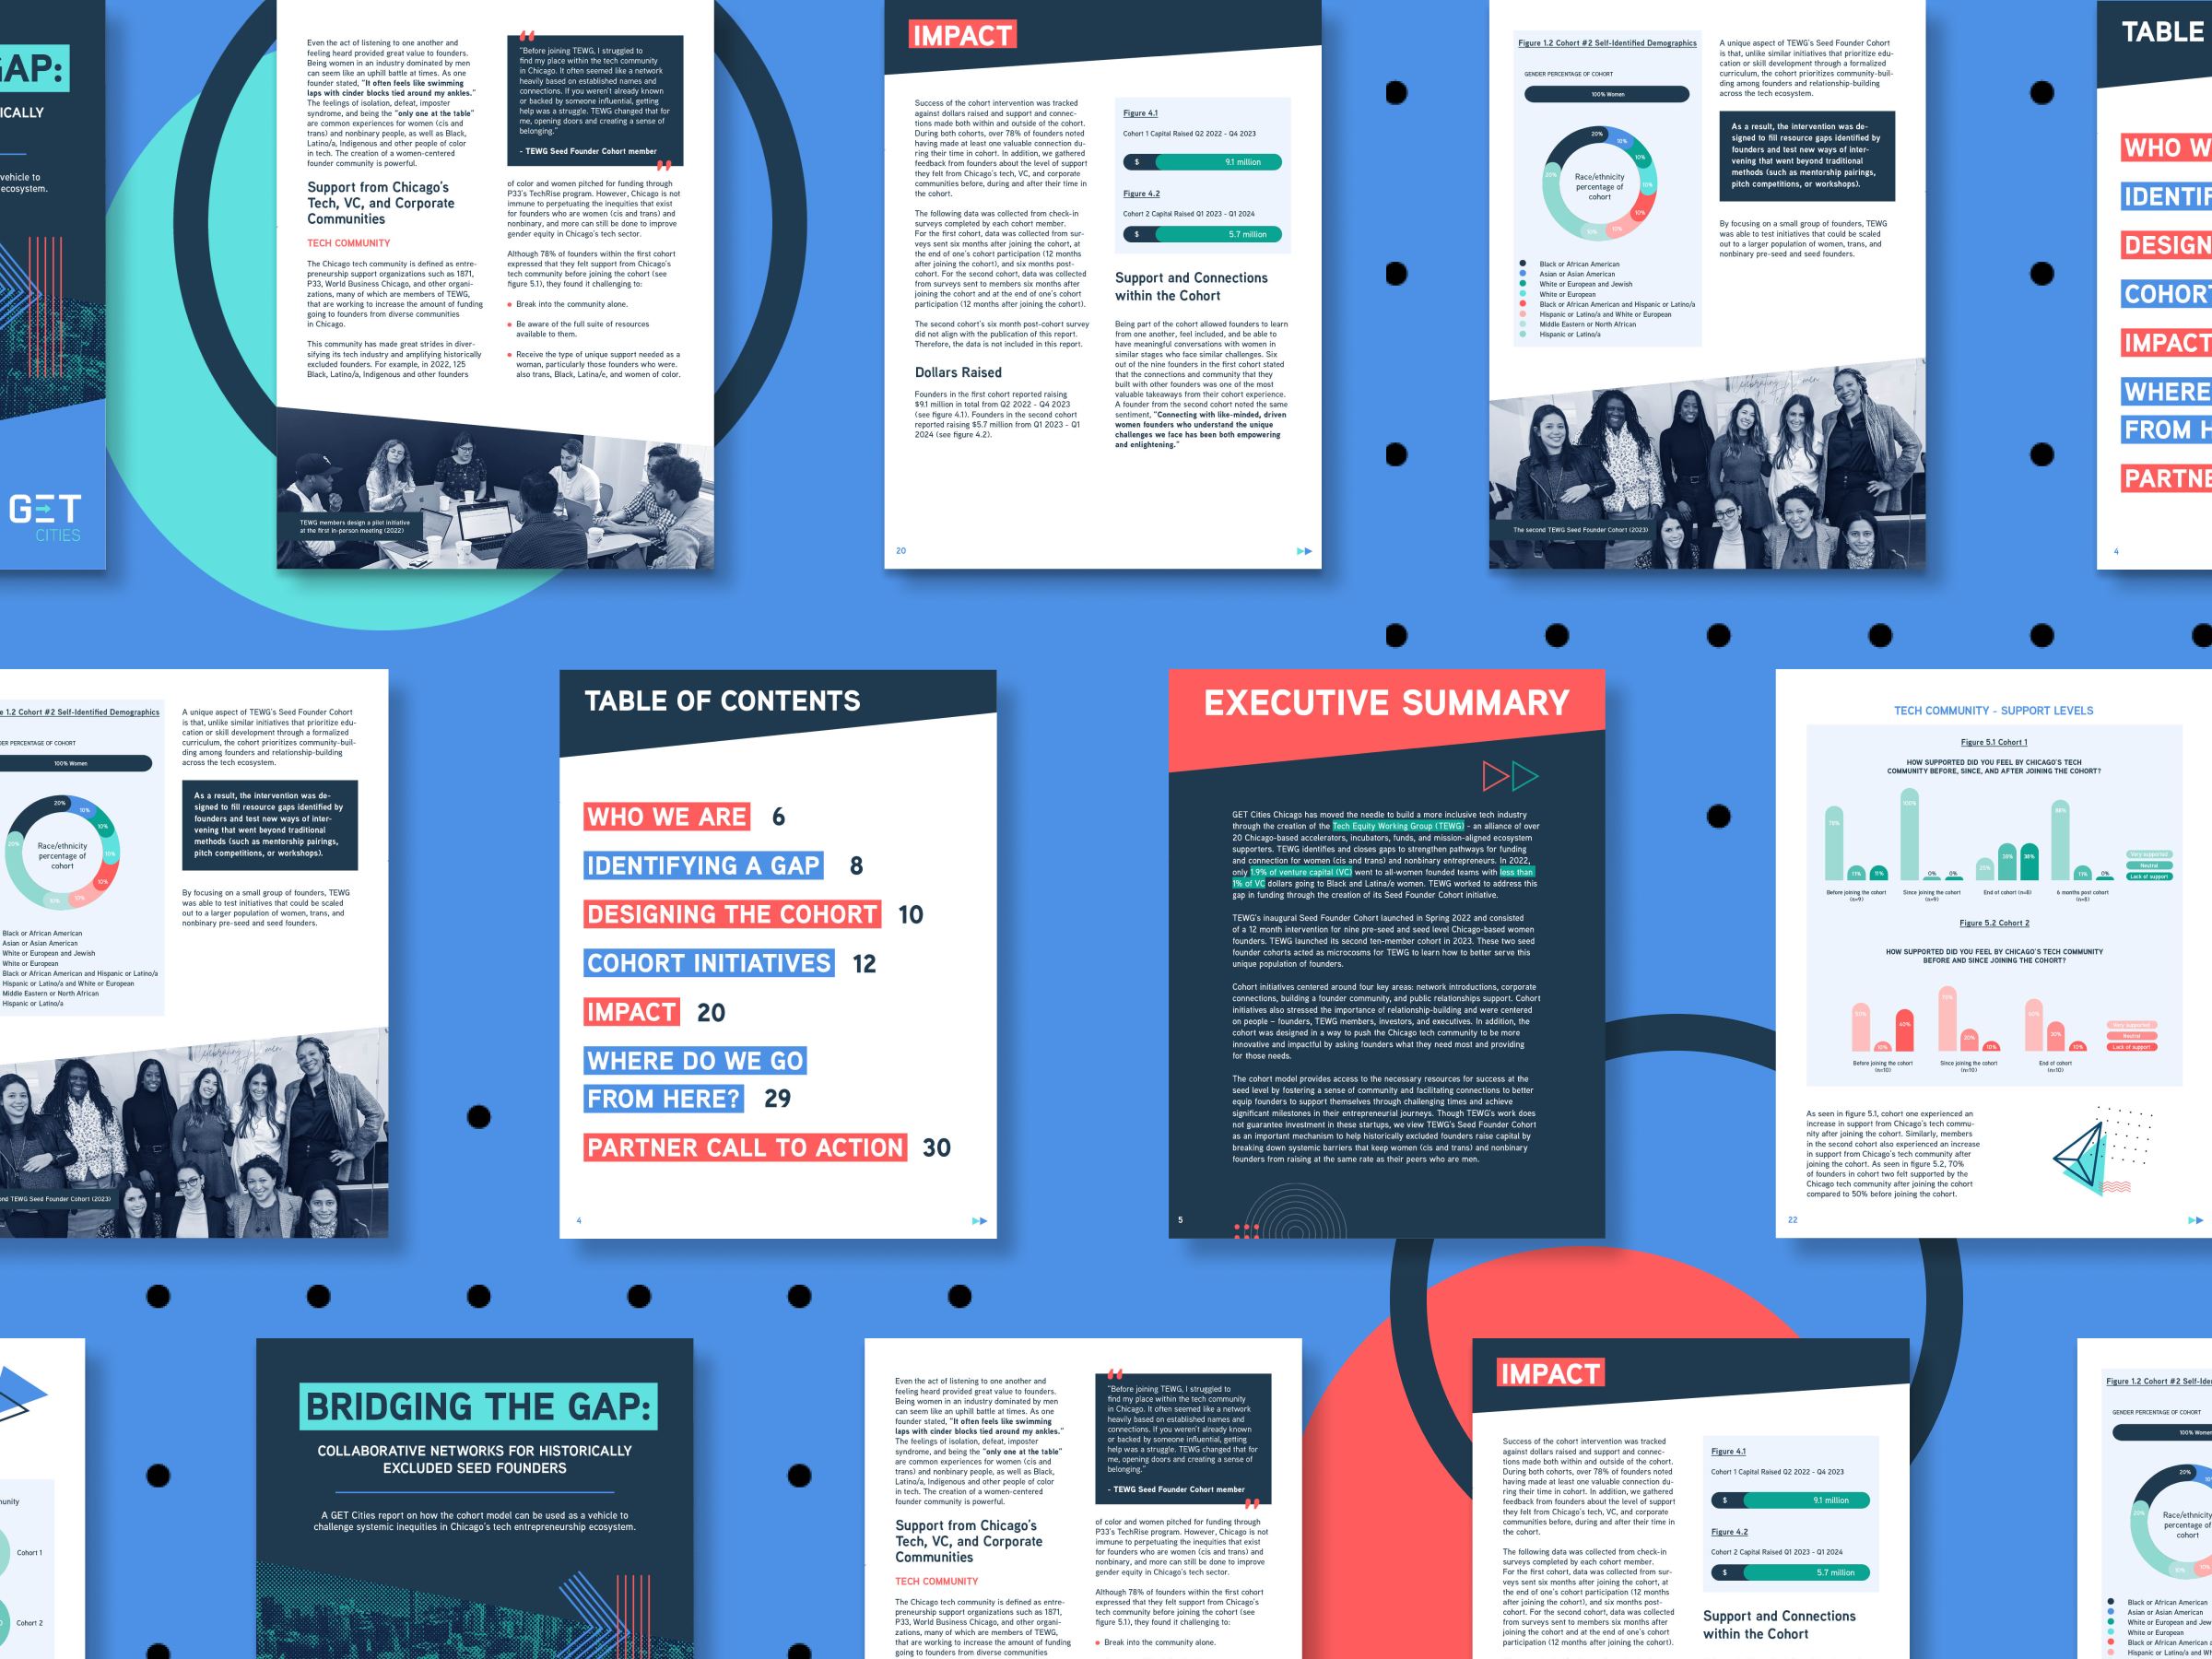
GET Cities is a fantastic initiative dedicated to tackling gender inequality and intersecting inequalities within the tech sector. Focused on creating inclusive and diverse environments, GET Cities aims to bridge the gap in tech entrepreneurship by supporting marginalised groups in the industry. We collaborated with GET Cities to design an engaging report titled “Bridging the Gap: Collaborative Networks for Historically Excluded Seed Founders.” This report showcases the impact of GET Cities’ initiatives and their ongoing efforts to support women and nonbinary entrepreneurs.
Credits
Layout and Data Visualisation: Louise Jezequel
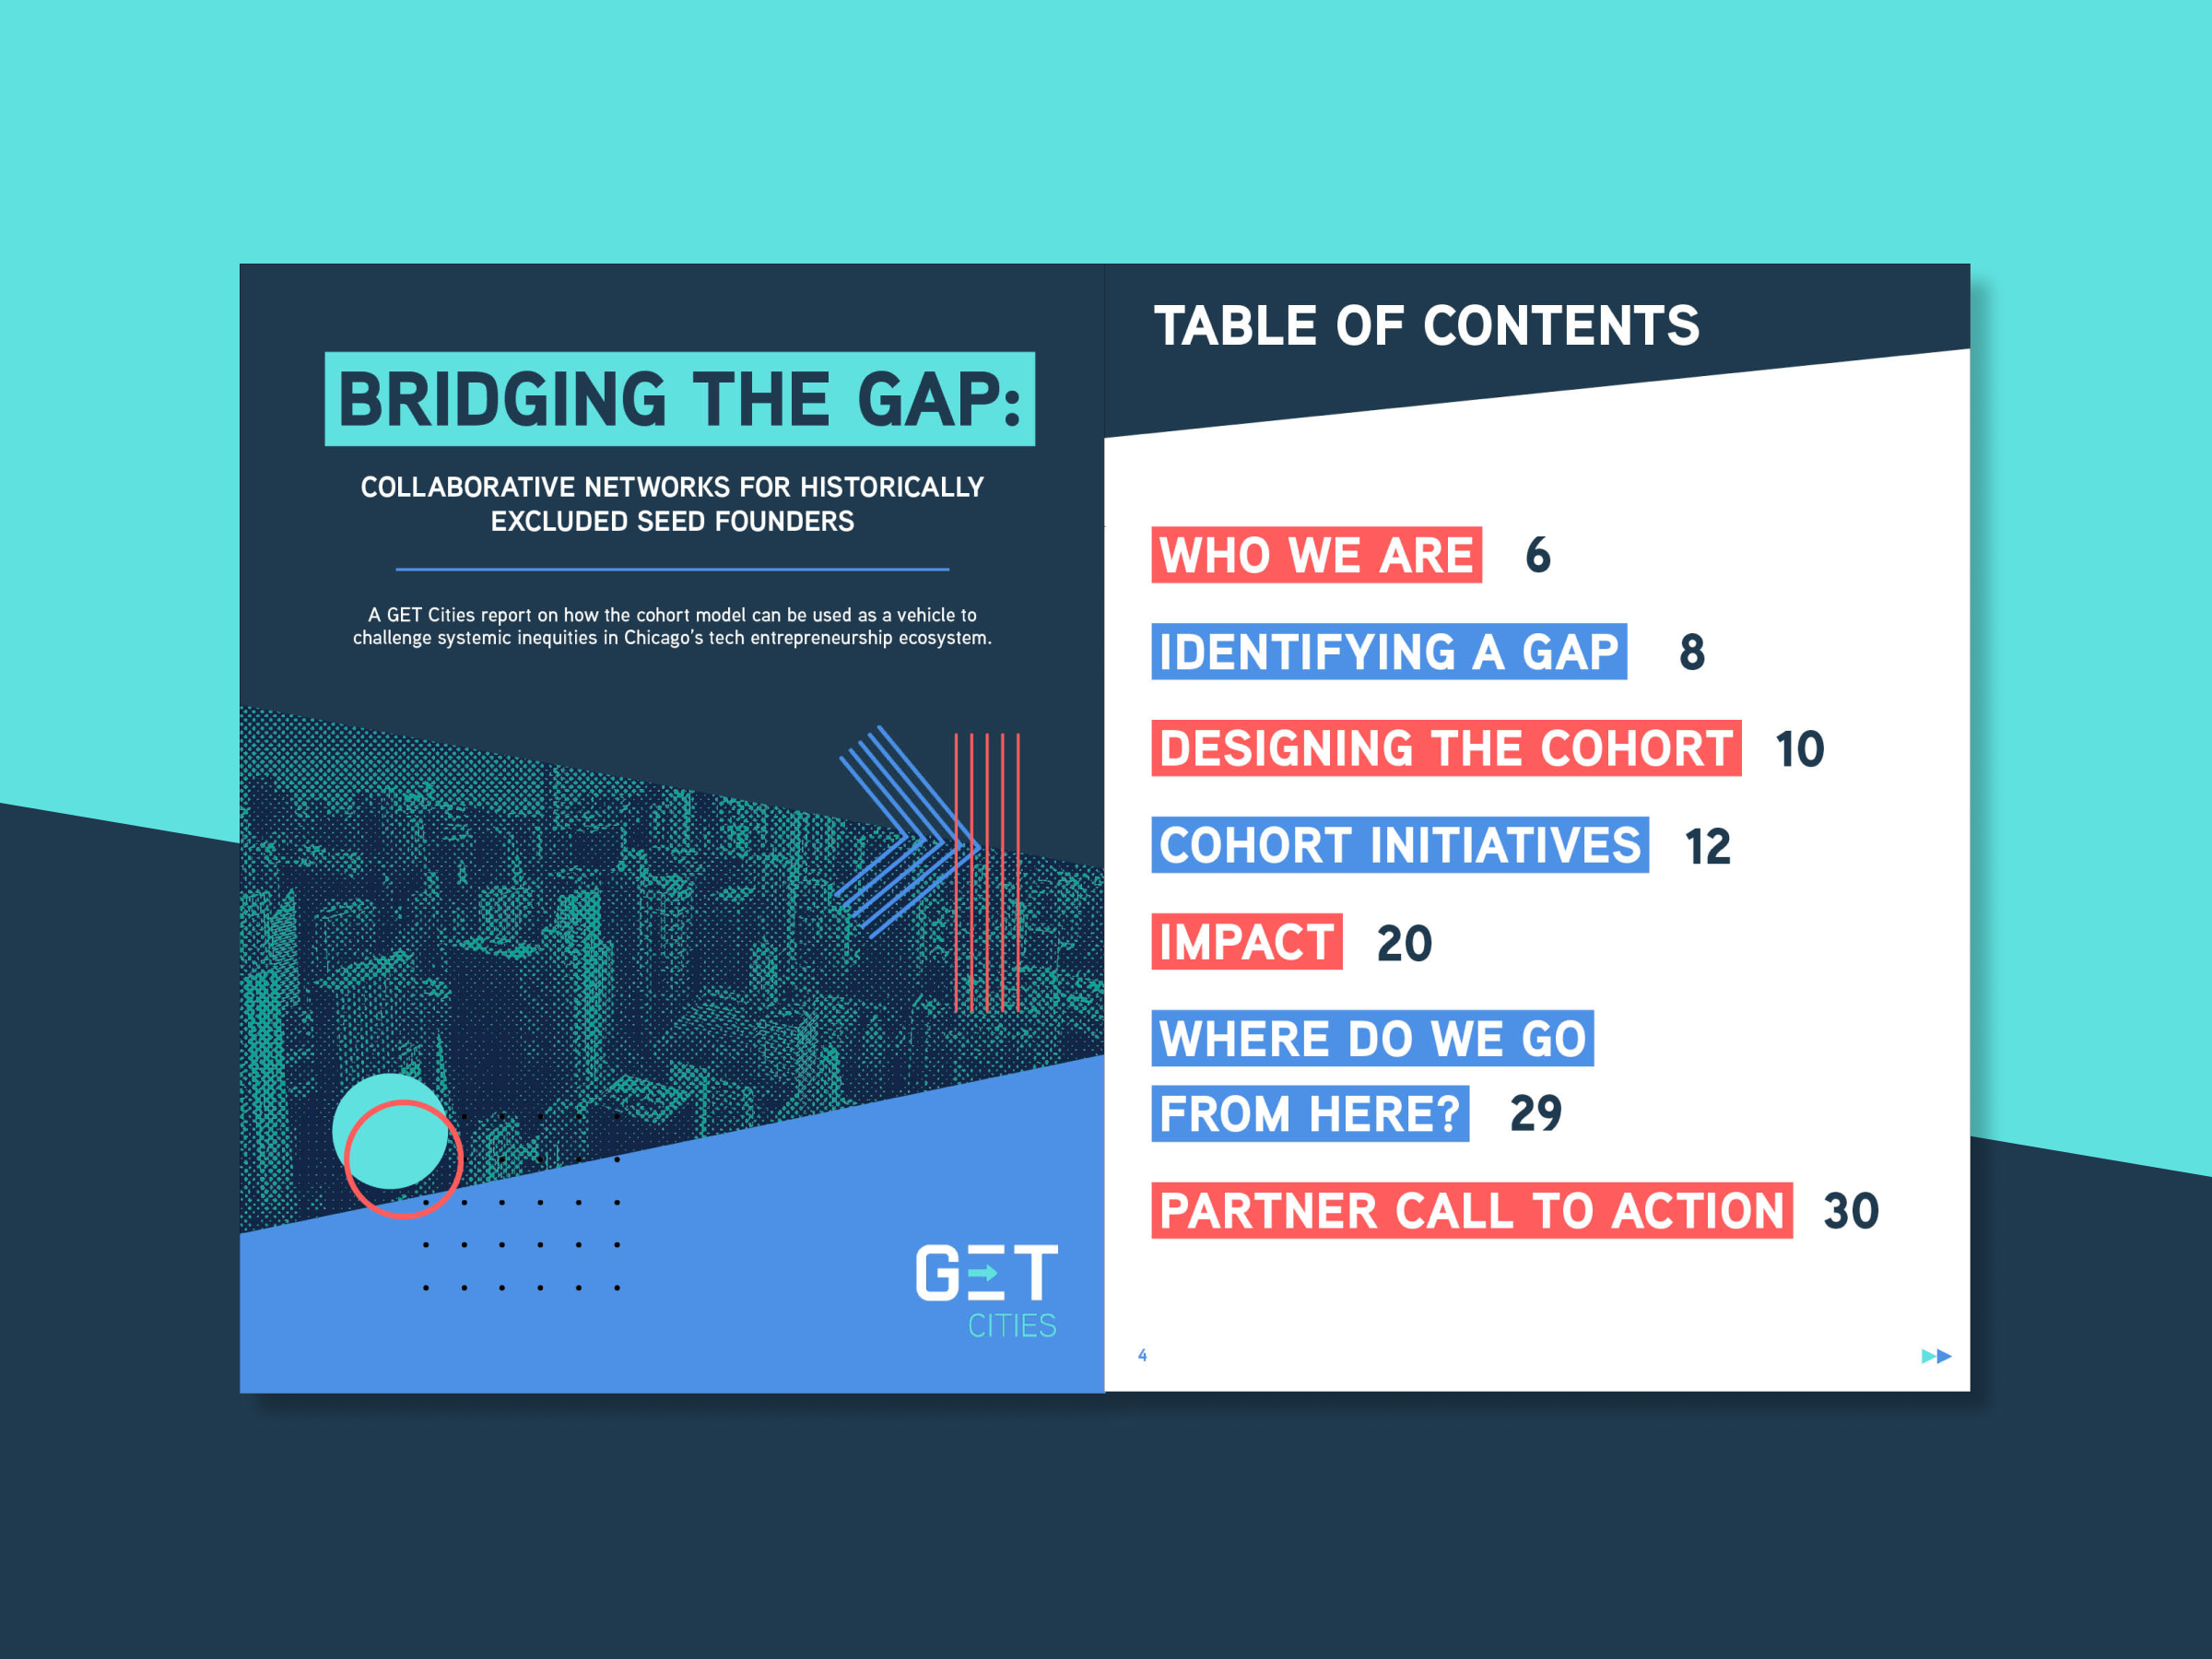
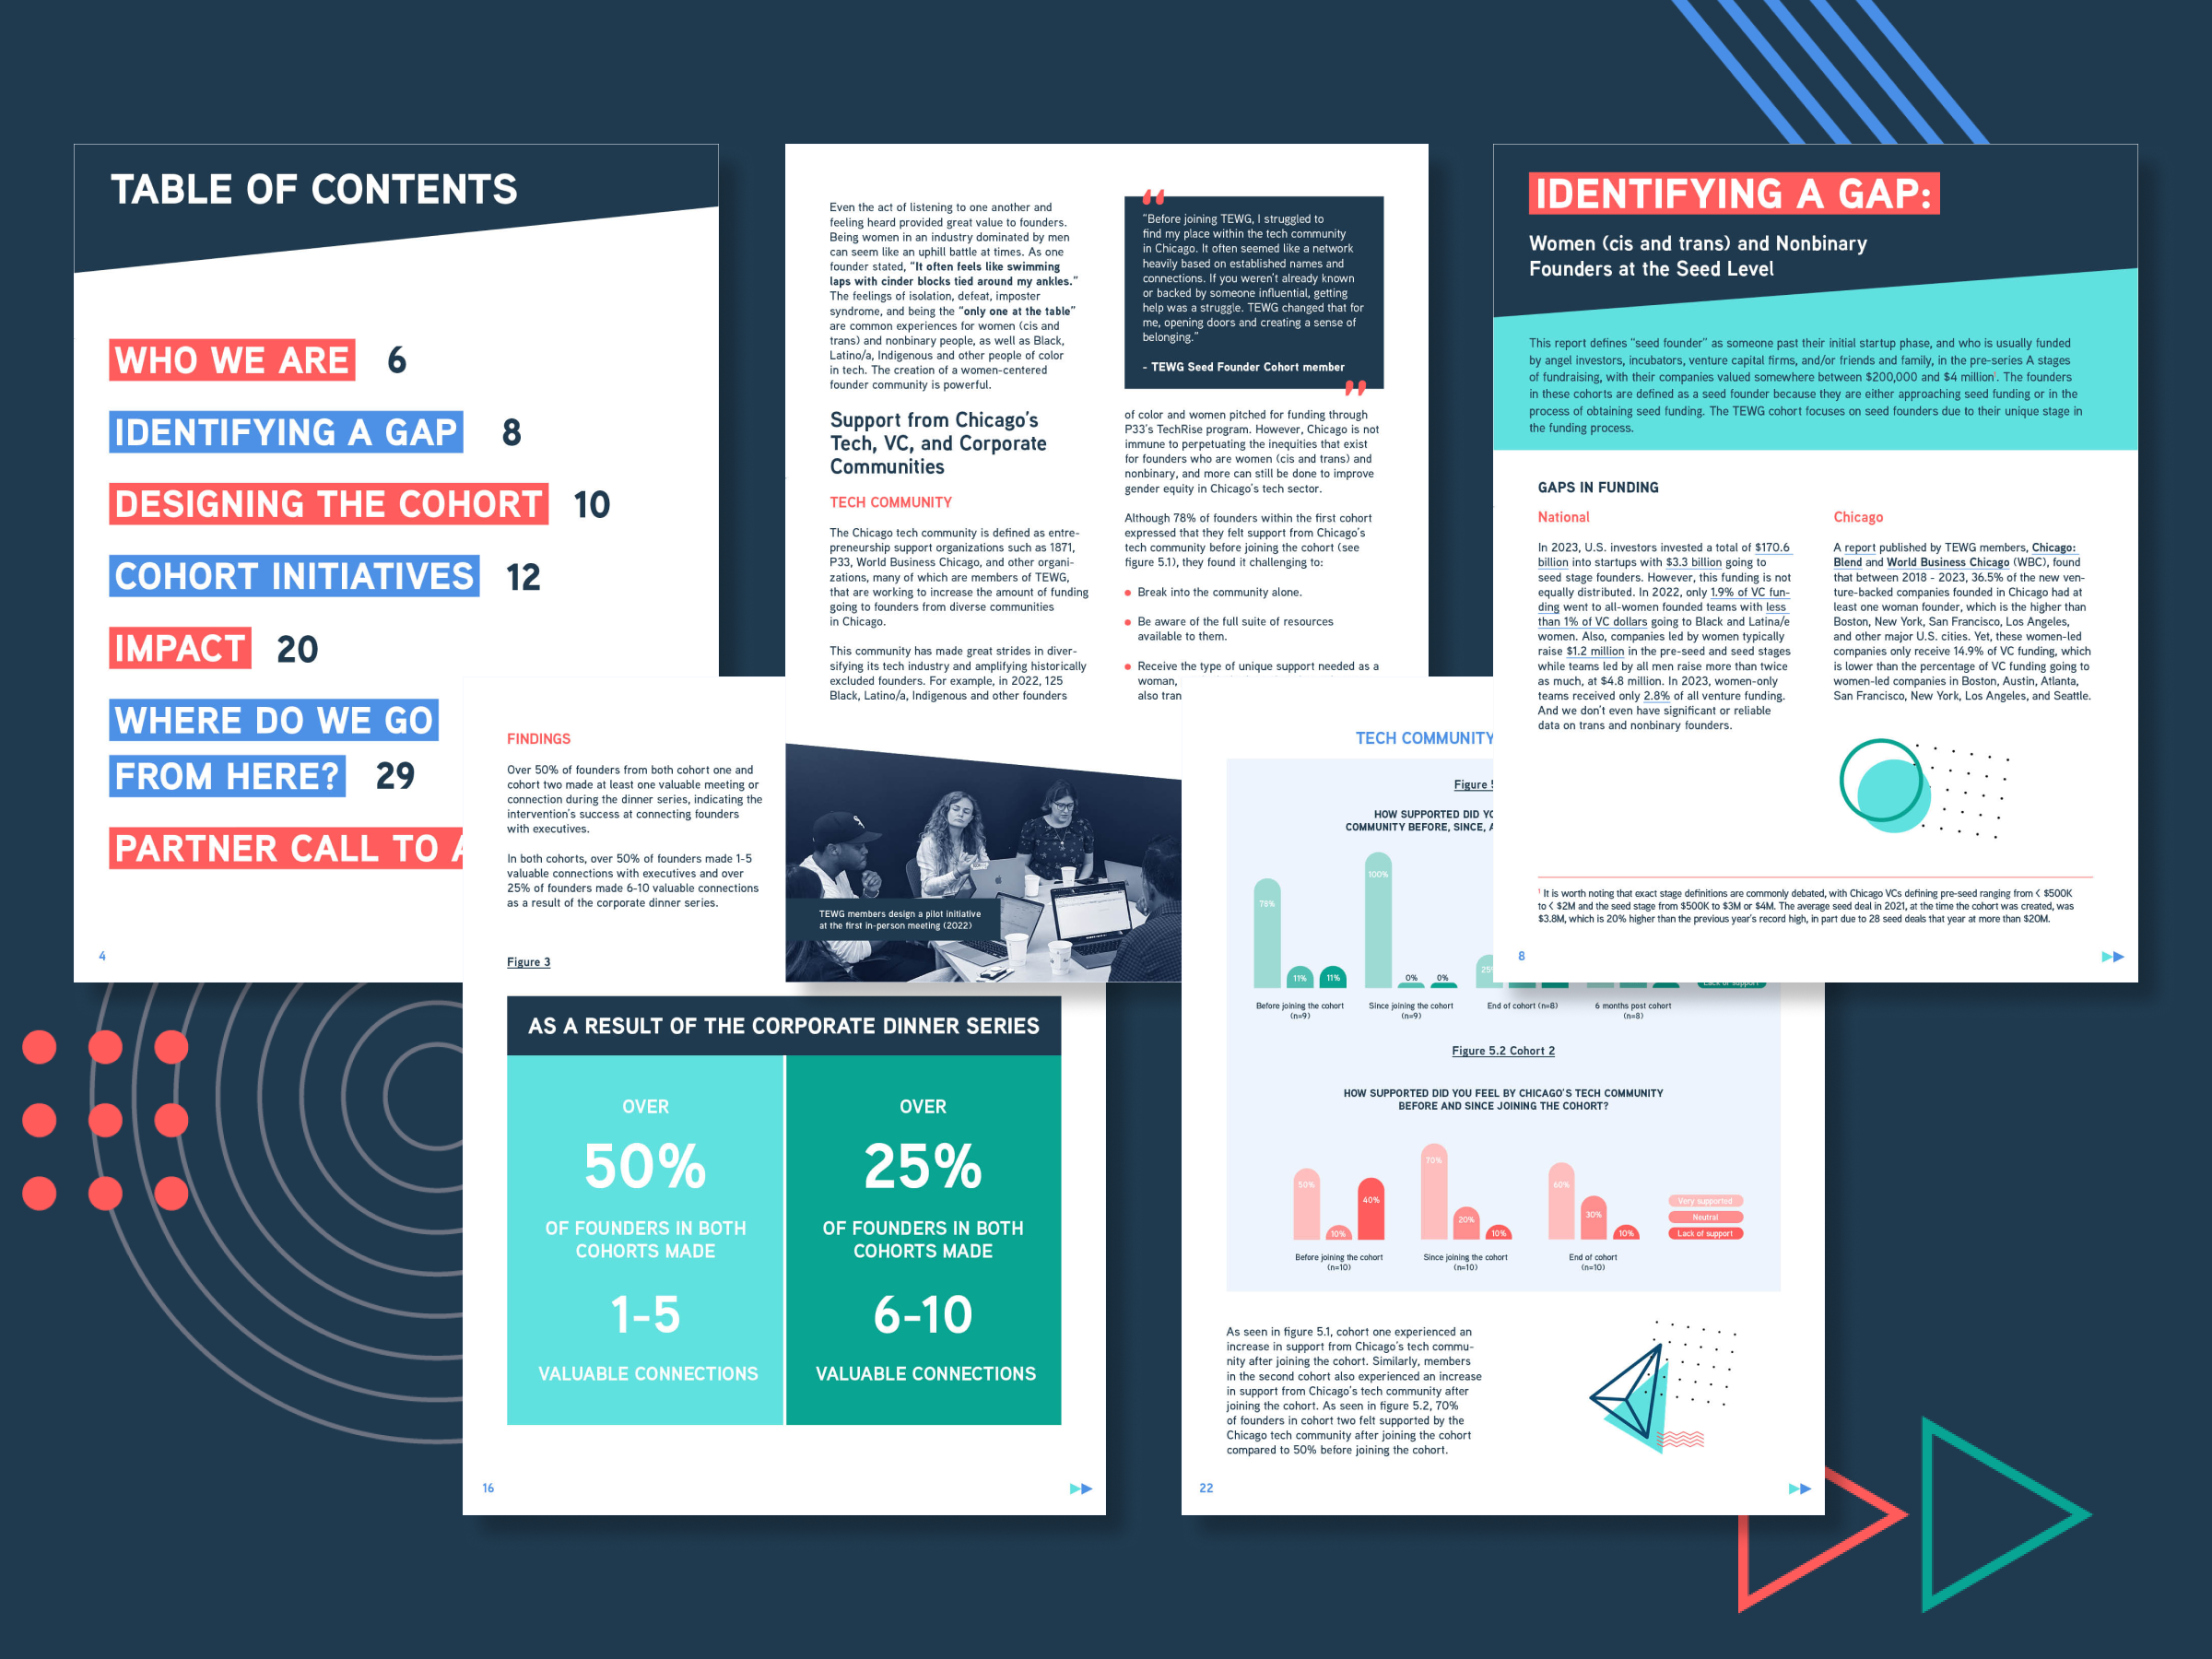
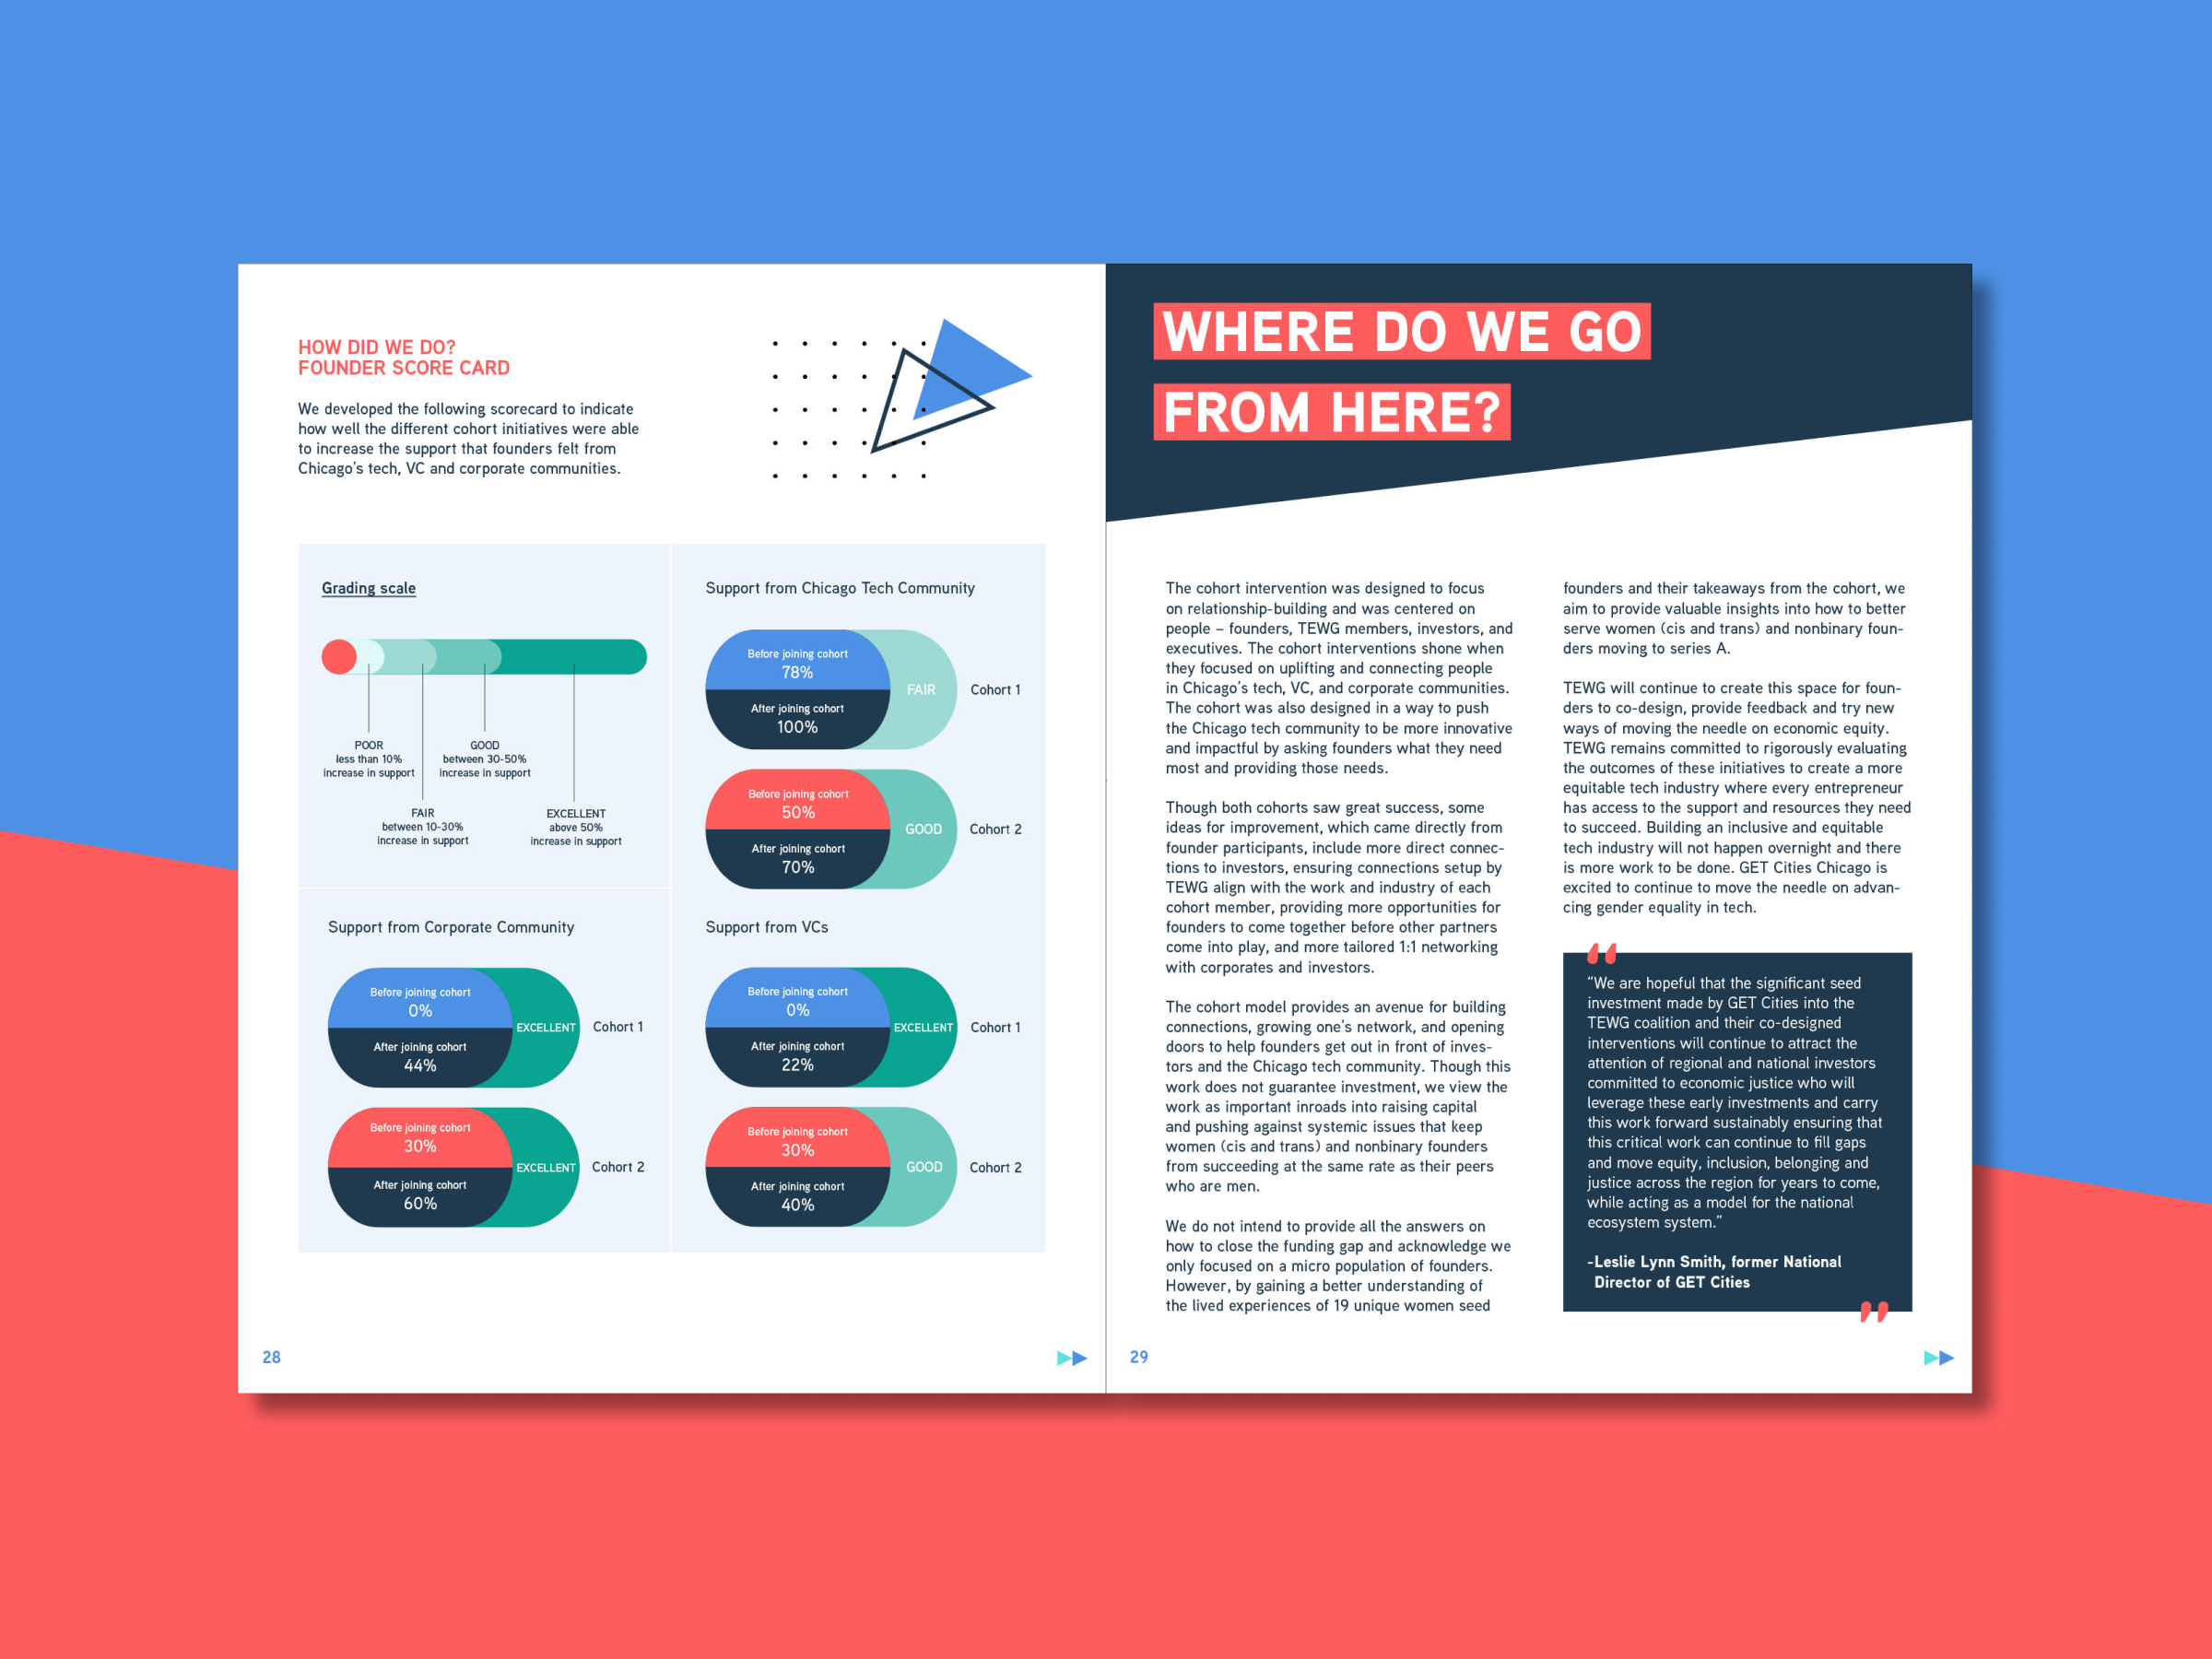
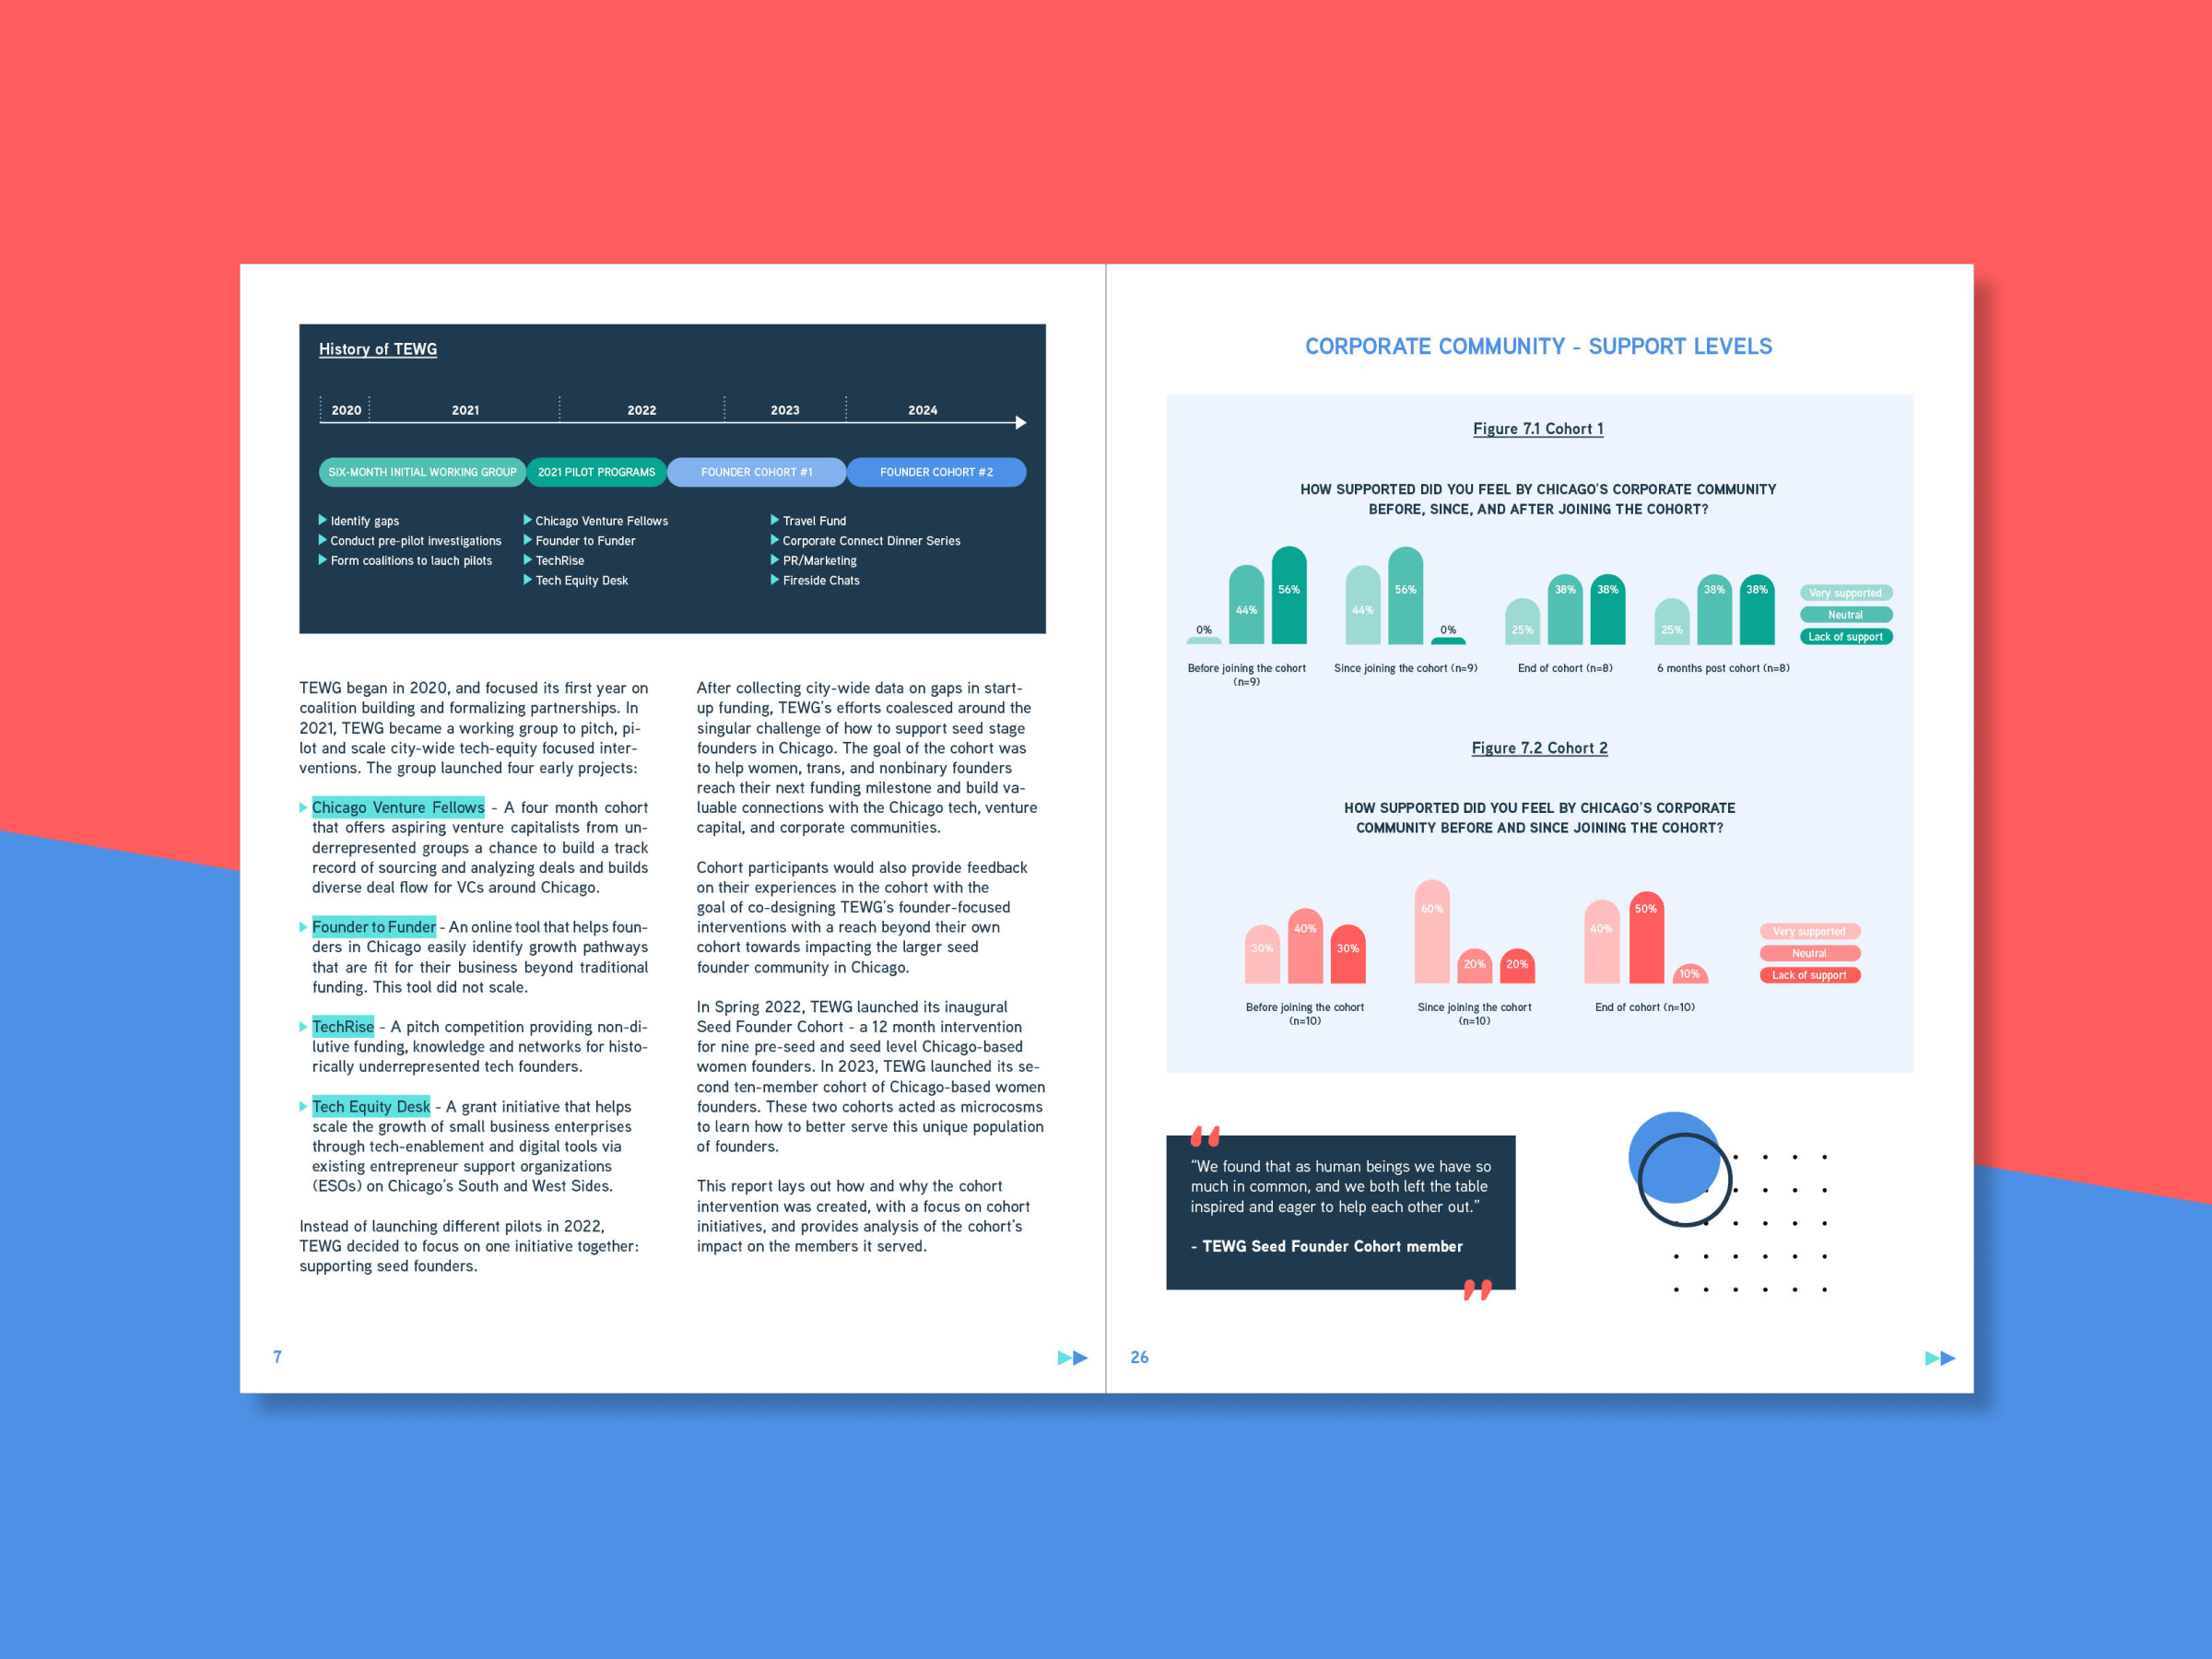
This report makes use of a range of layouts, with consistent application of elements to balance interest with predictable harmony. Combined with a clear visual hierarchy between elements, the report guides readers through the content effortlessly, making the information easy to navigate and digest. The cover design, with its cityscape in a halftone pattern, adds dynamic texture and enhances the modern aesthetic of GET Cities’ brand.
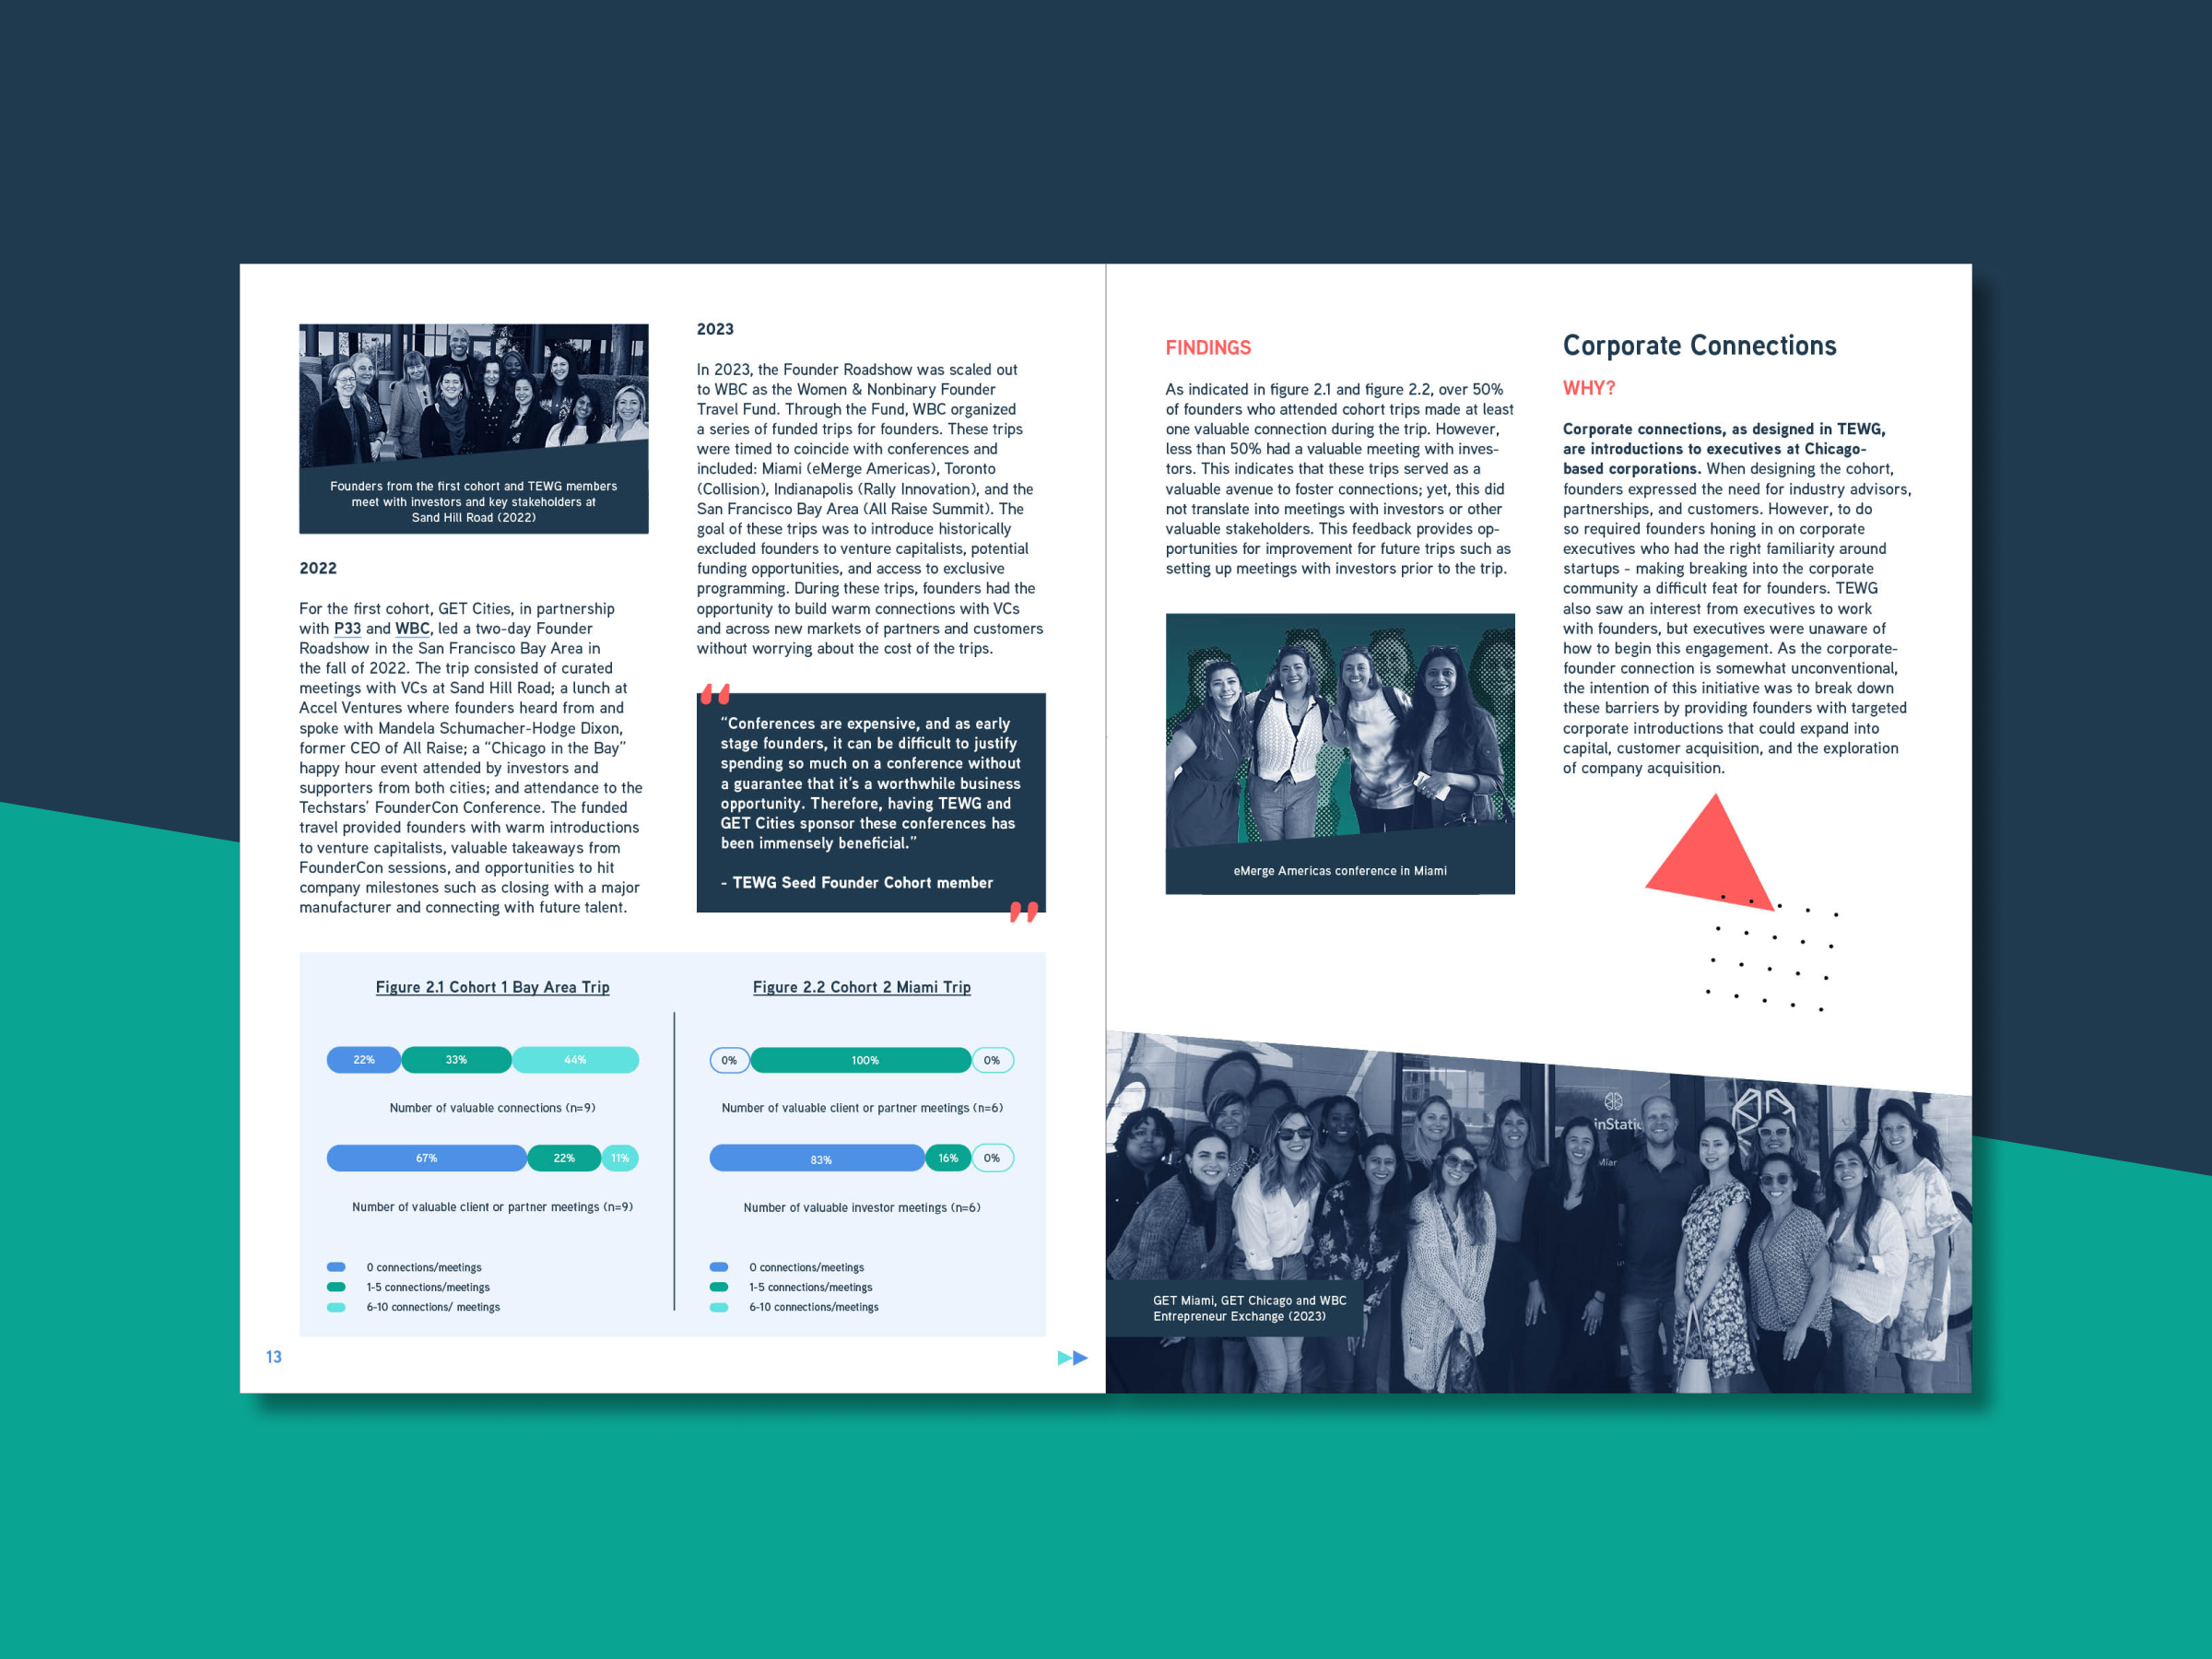
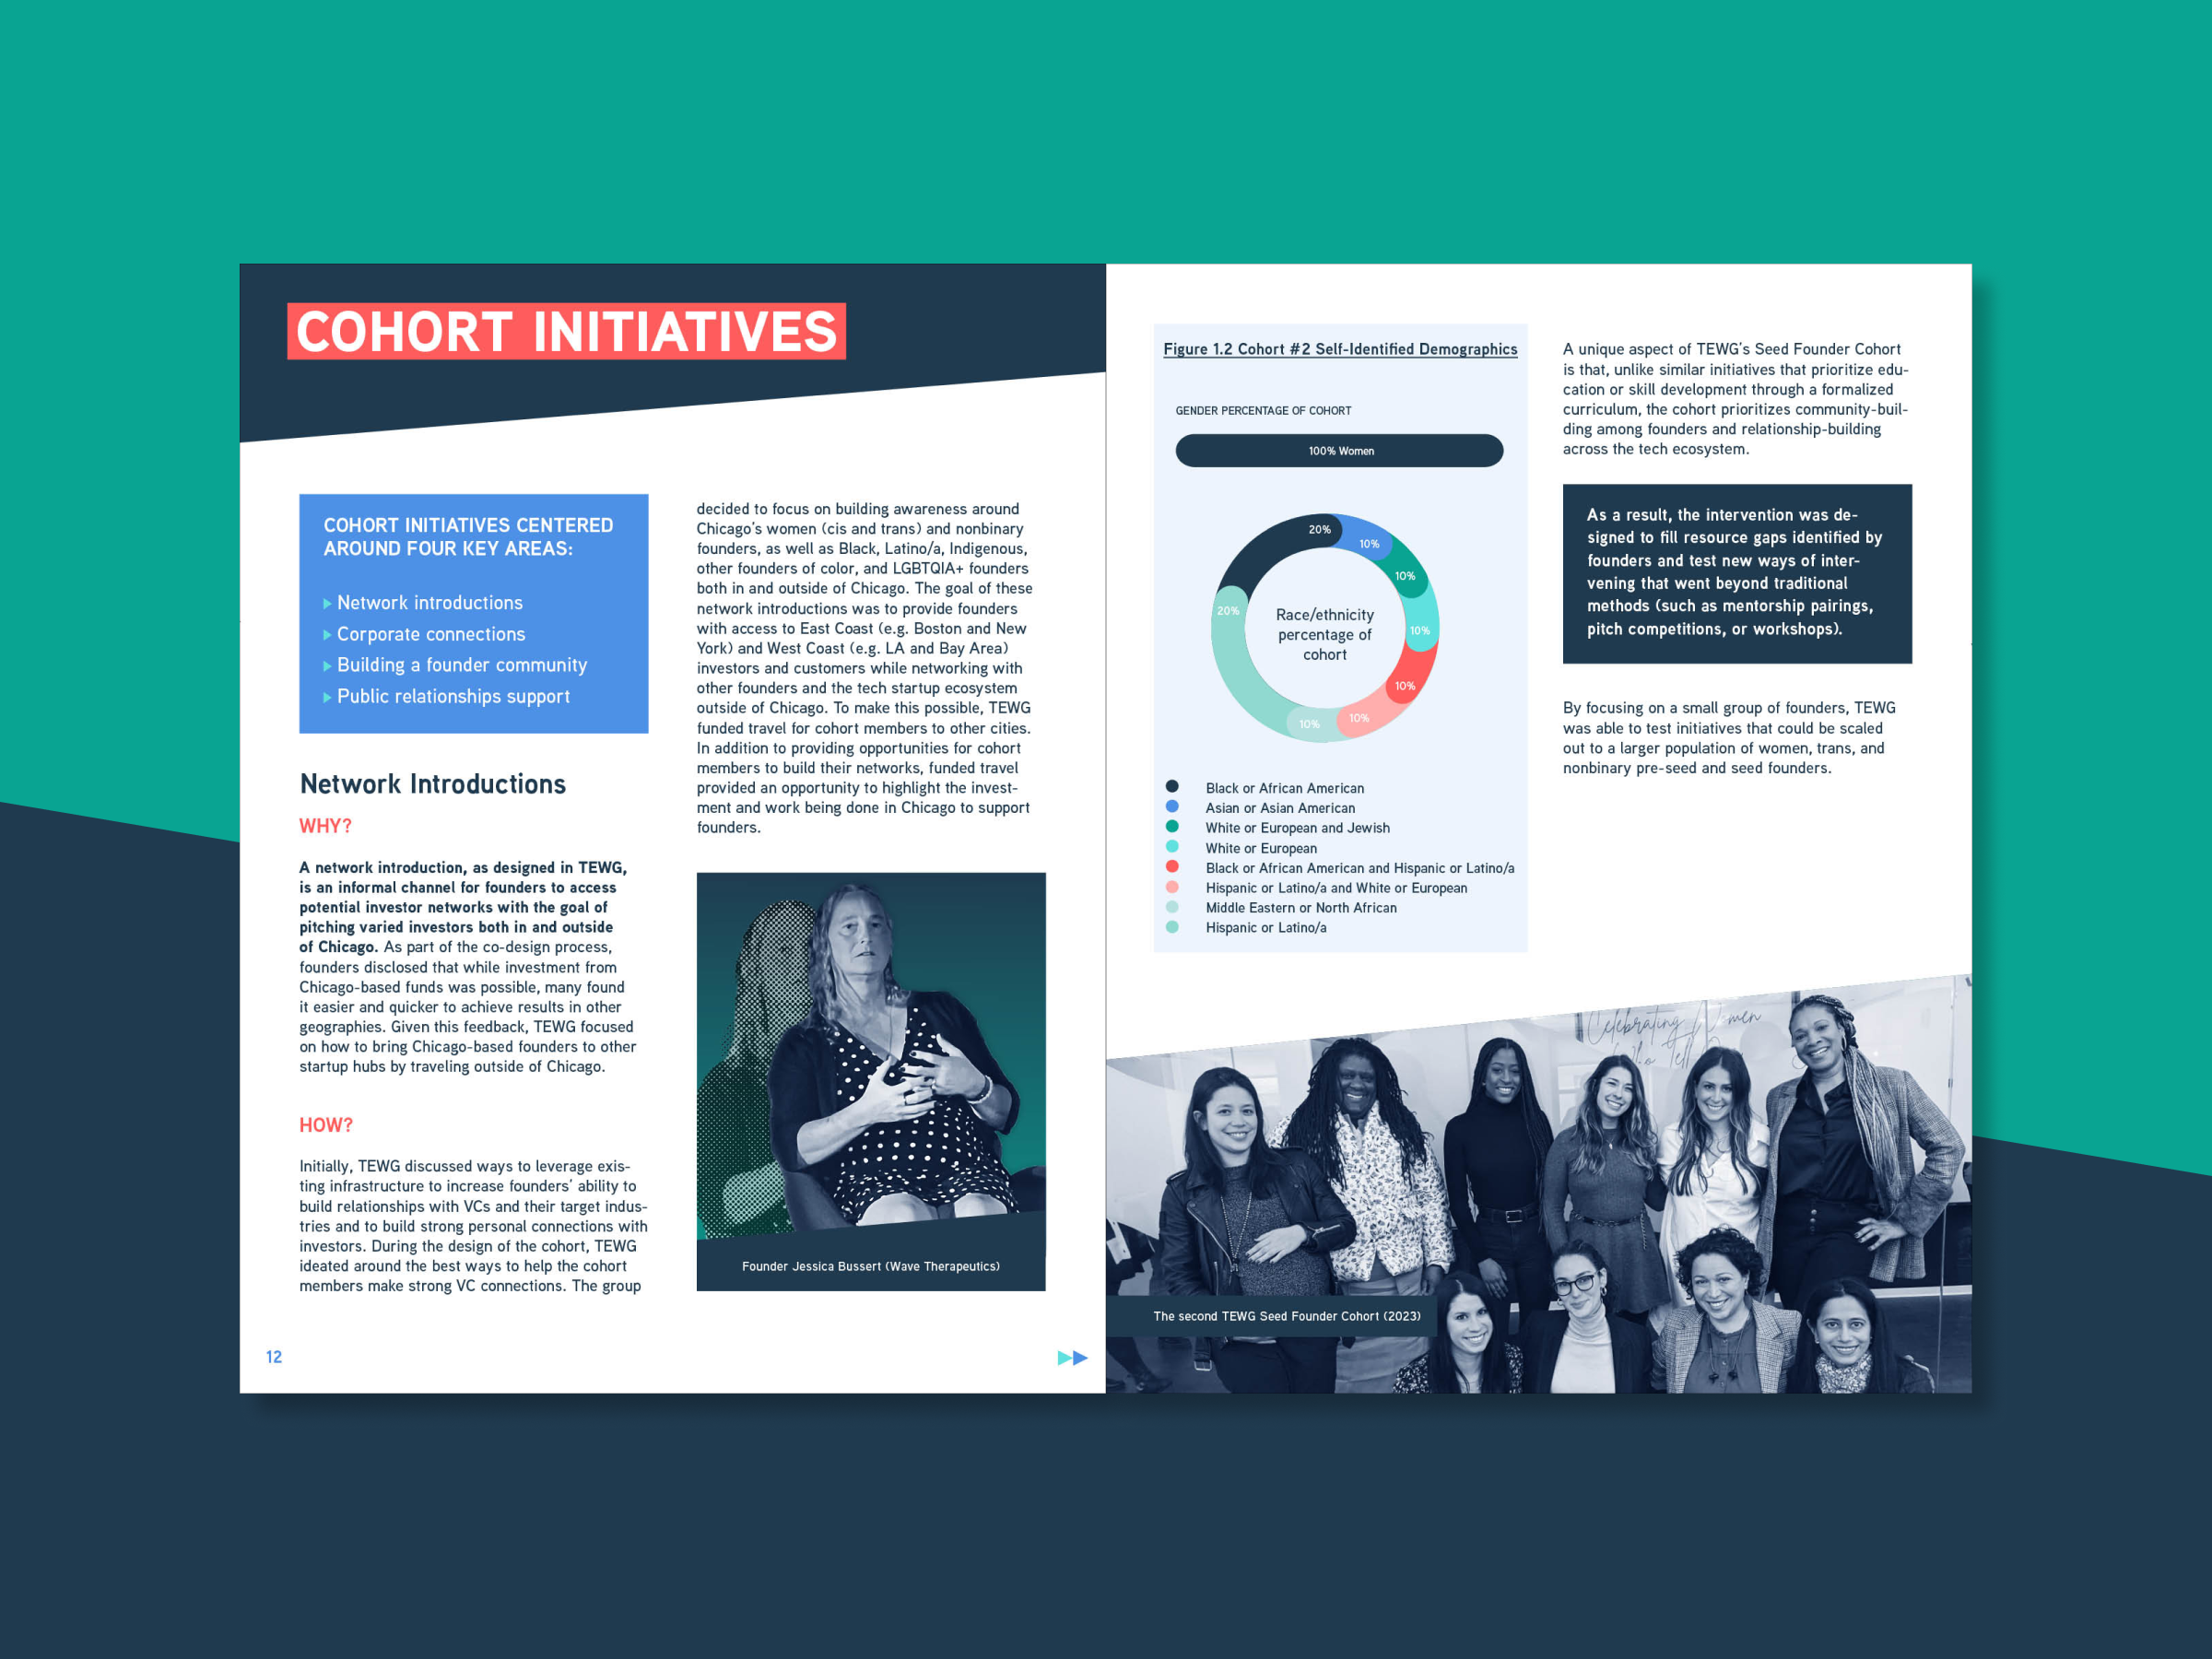
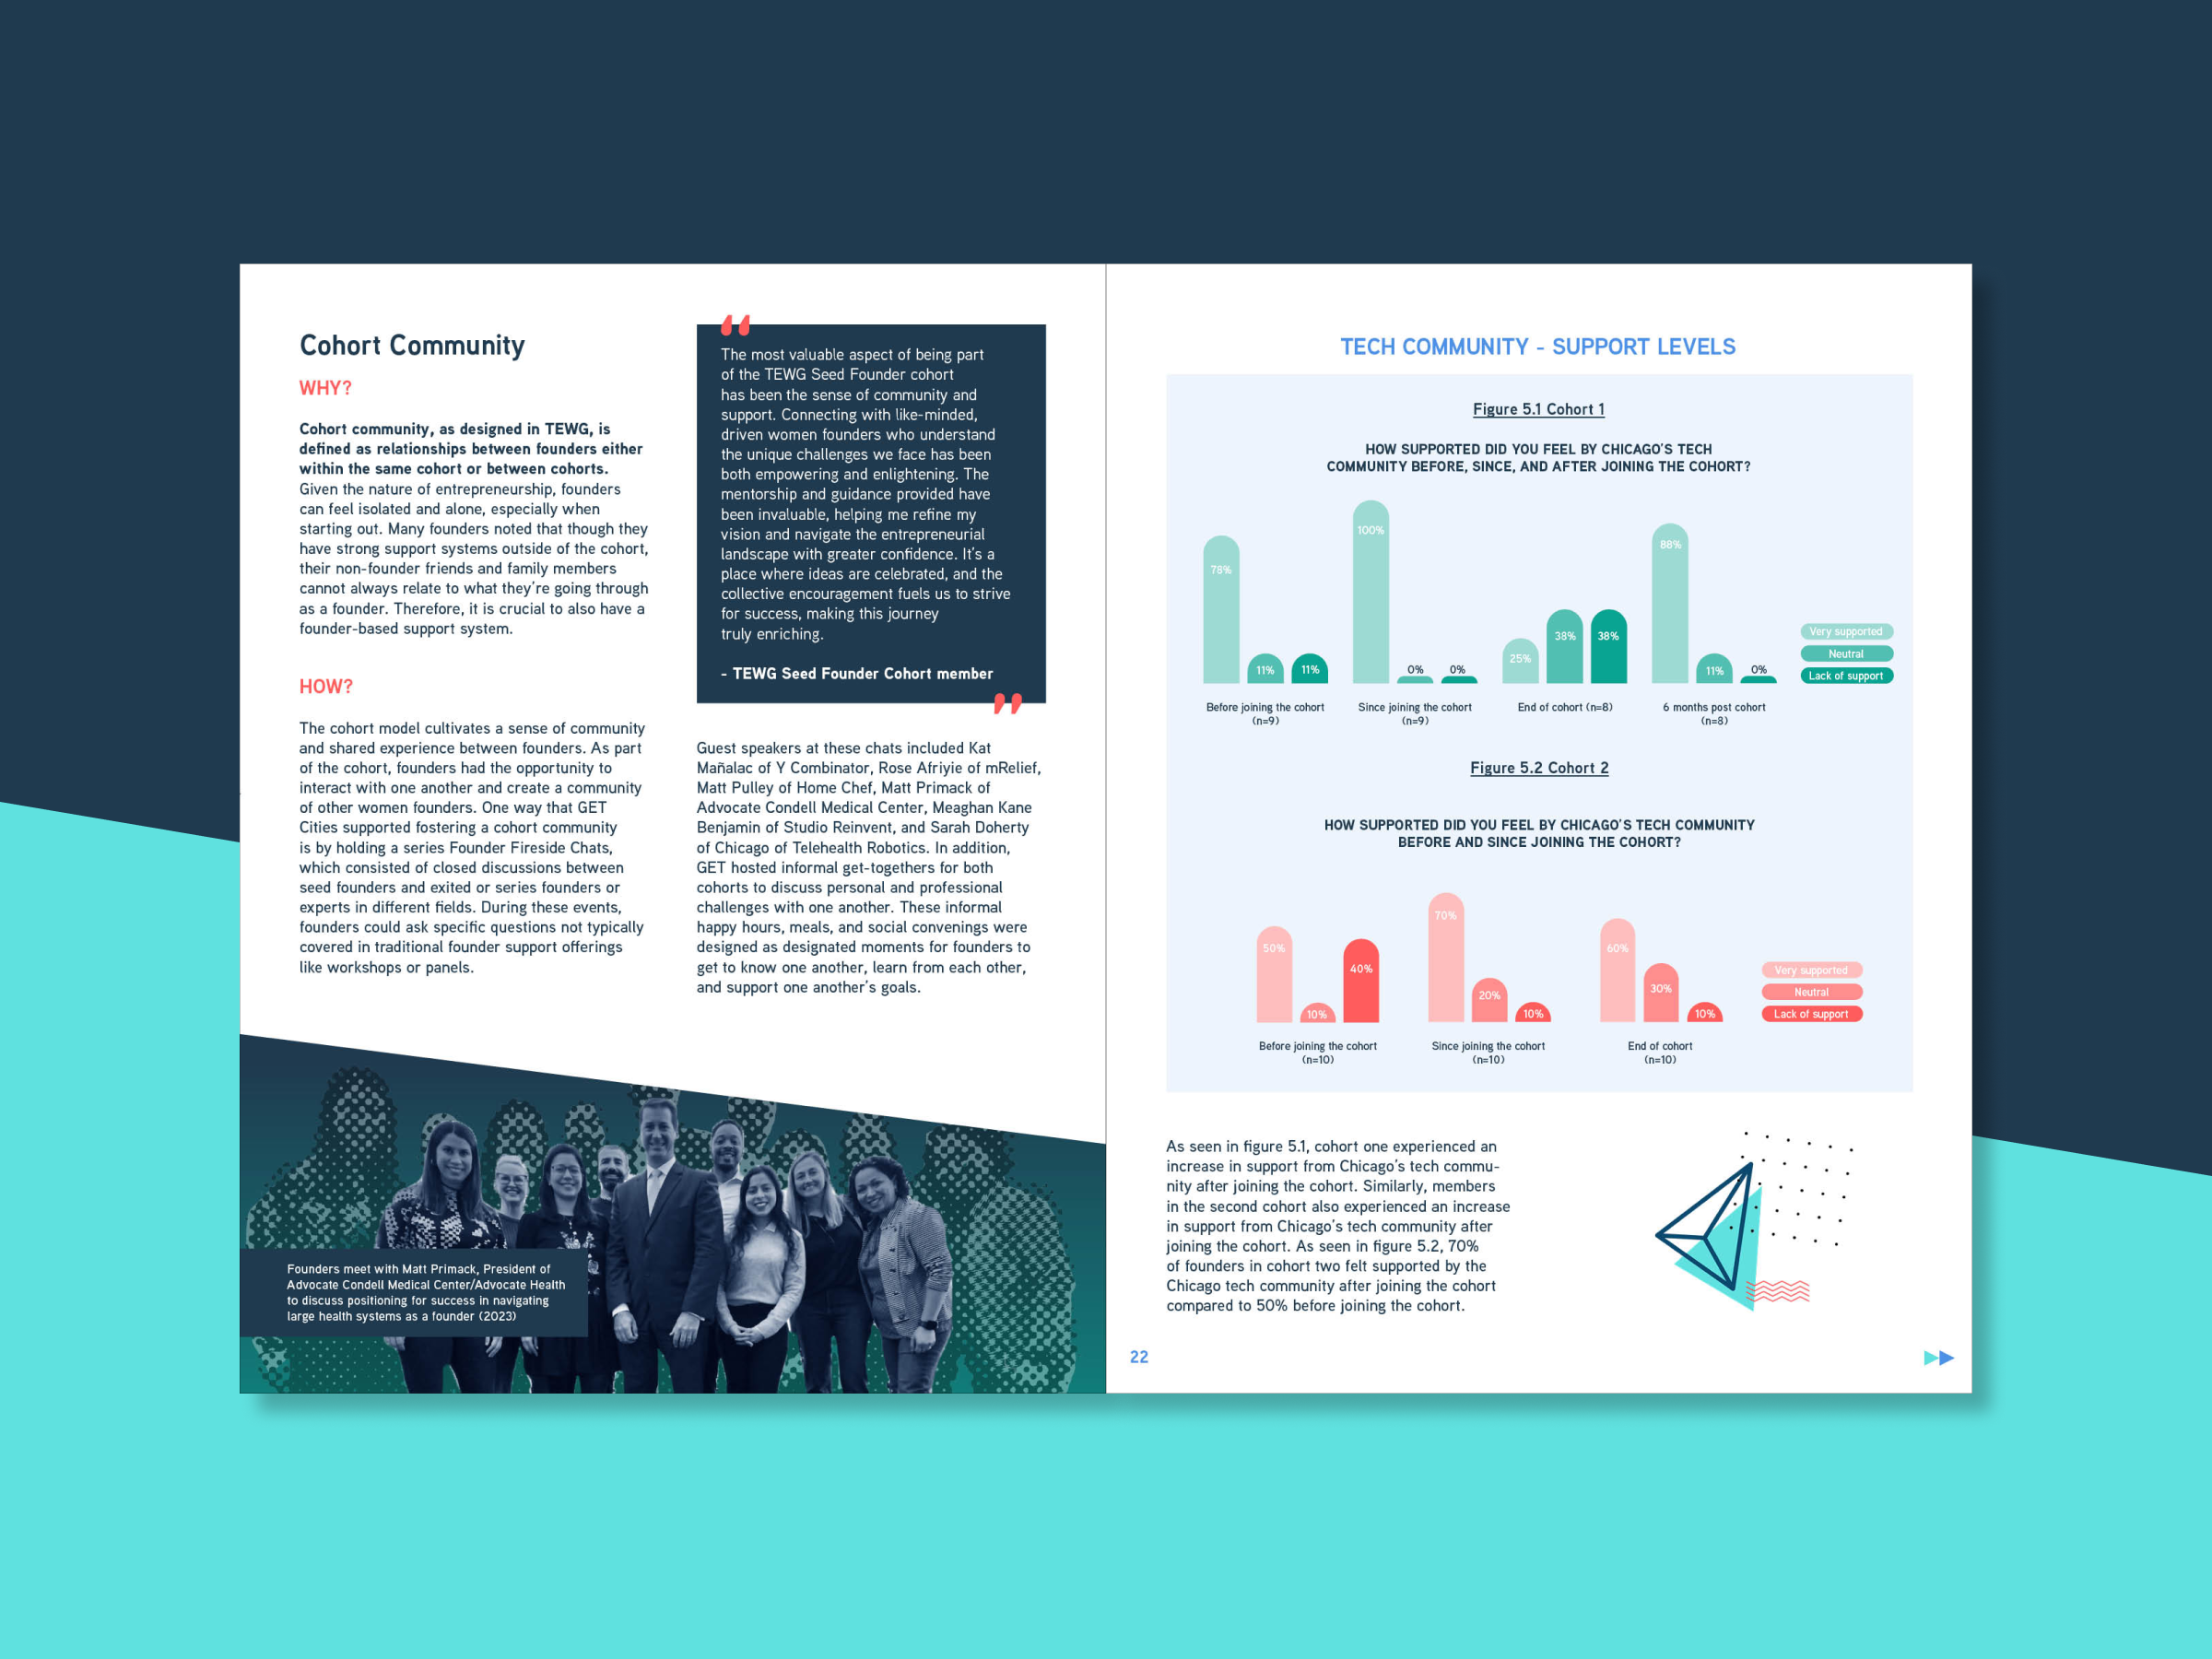
Our design seamlessly integrates custom infographics and data visualisations to break up text and add visual interest. High contrast between text and background colours ensures that the content is accessible. We used asymmetrical frames of black and white images to frame text, adding unique graphic motifs that aid readability.
All infographics and data visualisations were custom-designed to ensure clarity and engagement. All graphic elements were crafted with inclusivity in mind, reflecting the diverse communities that GET Cities supports. By focusing on accessibility and visual engagement, we aimed to create a report that is informative, impactful and appealing to a wide readership.
I loved working with the team; I wholeheartedly recommend supporting this organization (or hiring them!) if you are an inclusive organization that wants to center the experience of LGBTQIA+ and gender diverse individuals. Bookmark their link for your future reporting or design needs!
– Allison James, Senior Program Manager, Chicago, GET Cities