VOICE
The ‘Voter Opinion and Insight on Current Events’ survey (VOICE) is a longitudinal public opinion survey, led by academics at the University of Kent, VOICE came to us to help them attract participants to the survey, so they could collect data that could influence key policy decisions for years to come. We created a brand identity for VOICE, as well as designs for the online and print survey, as well as the mail-outs inviting people to participate.

Credits
Branding and Collateral: Alaïs de Saint Louvent
Branding
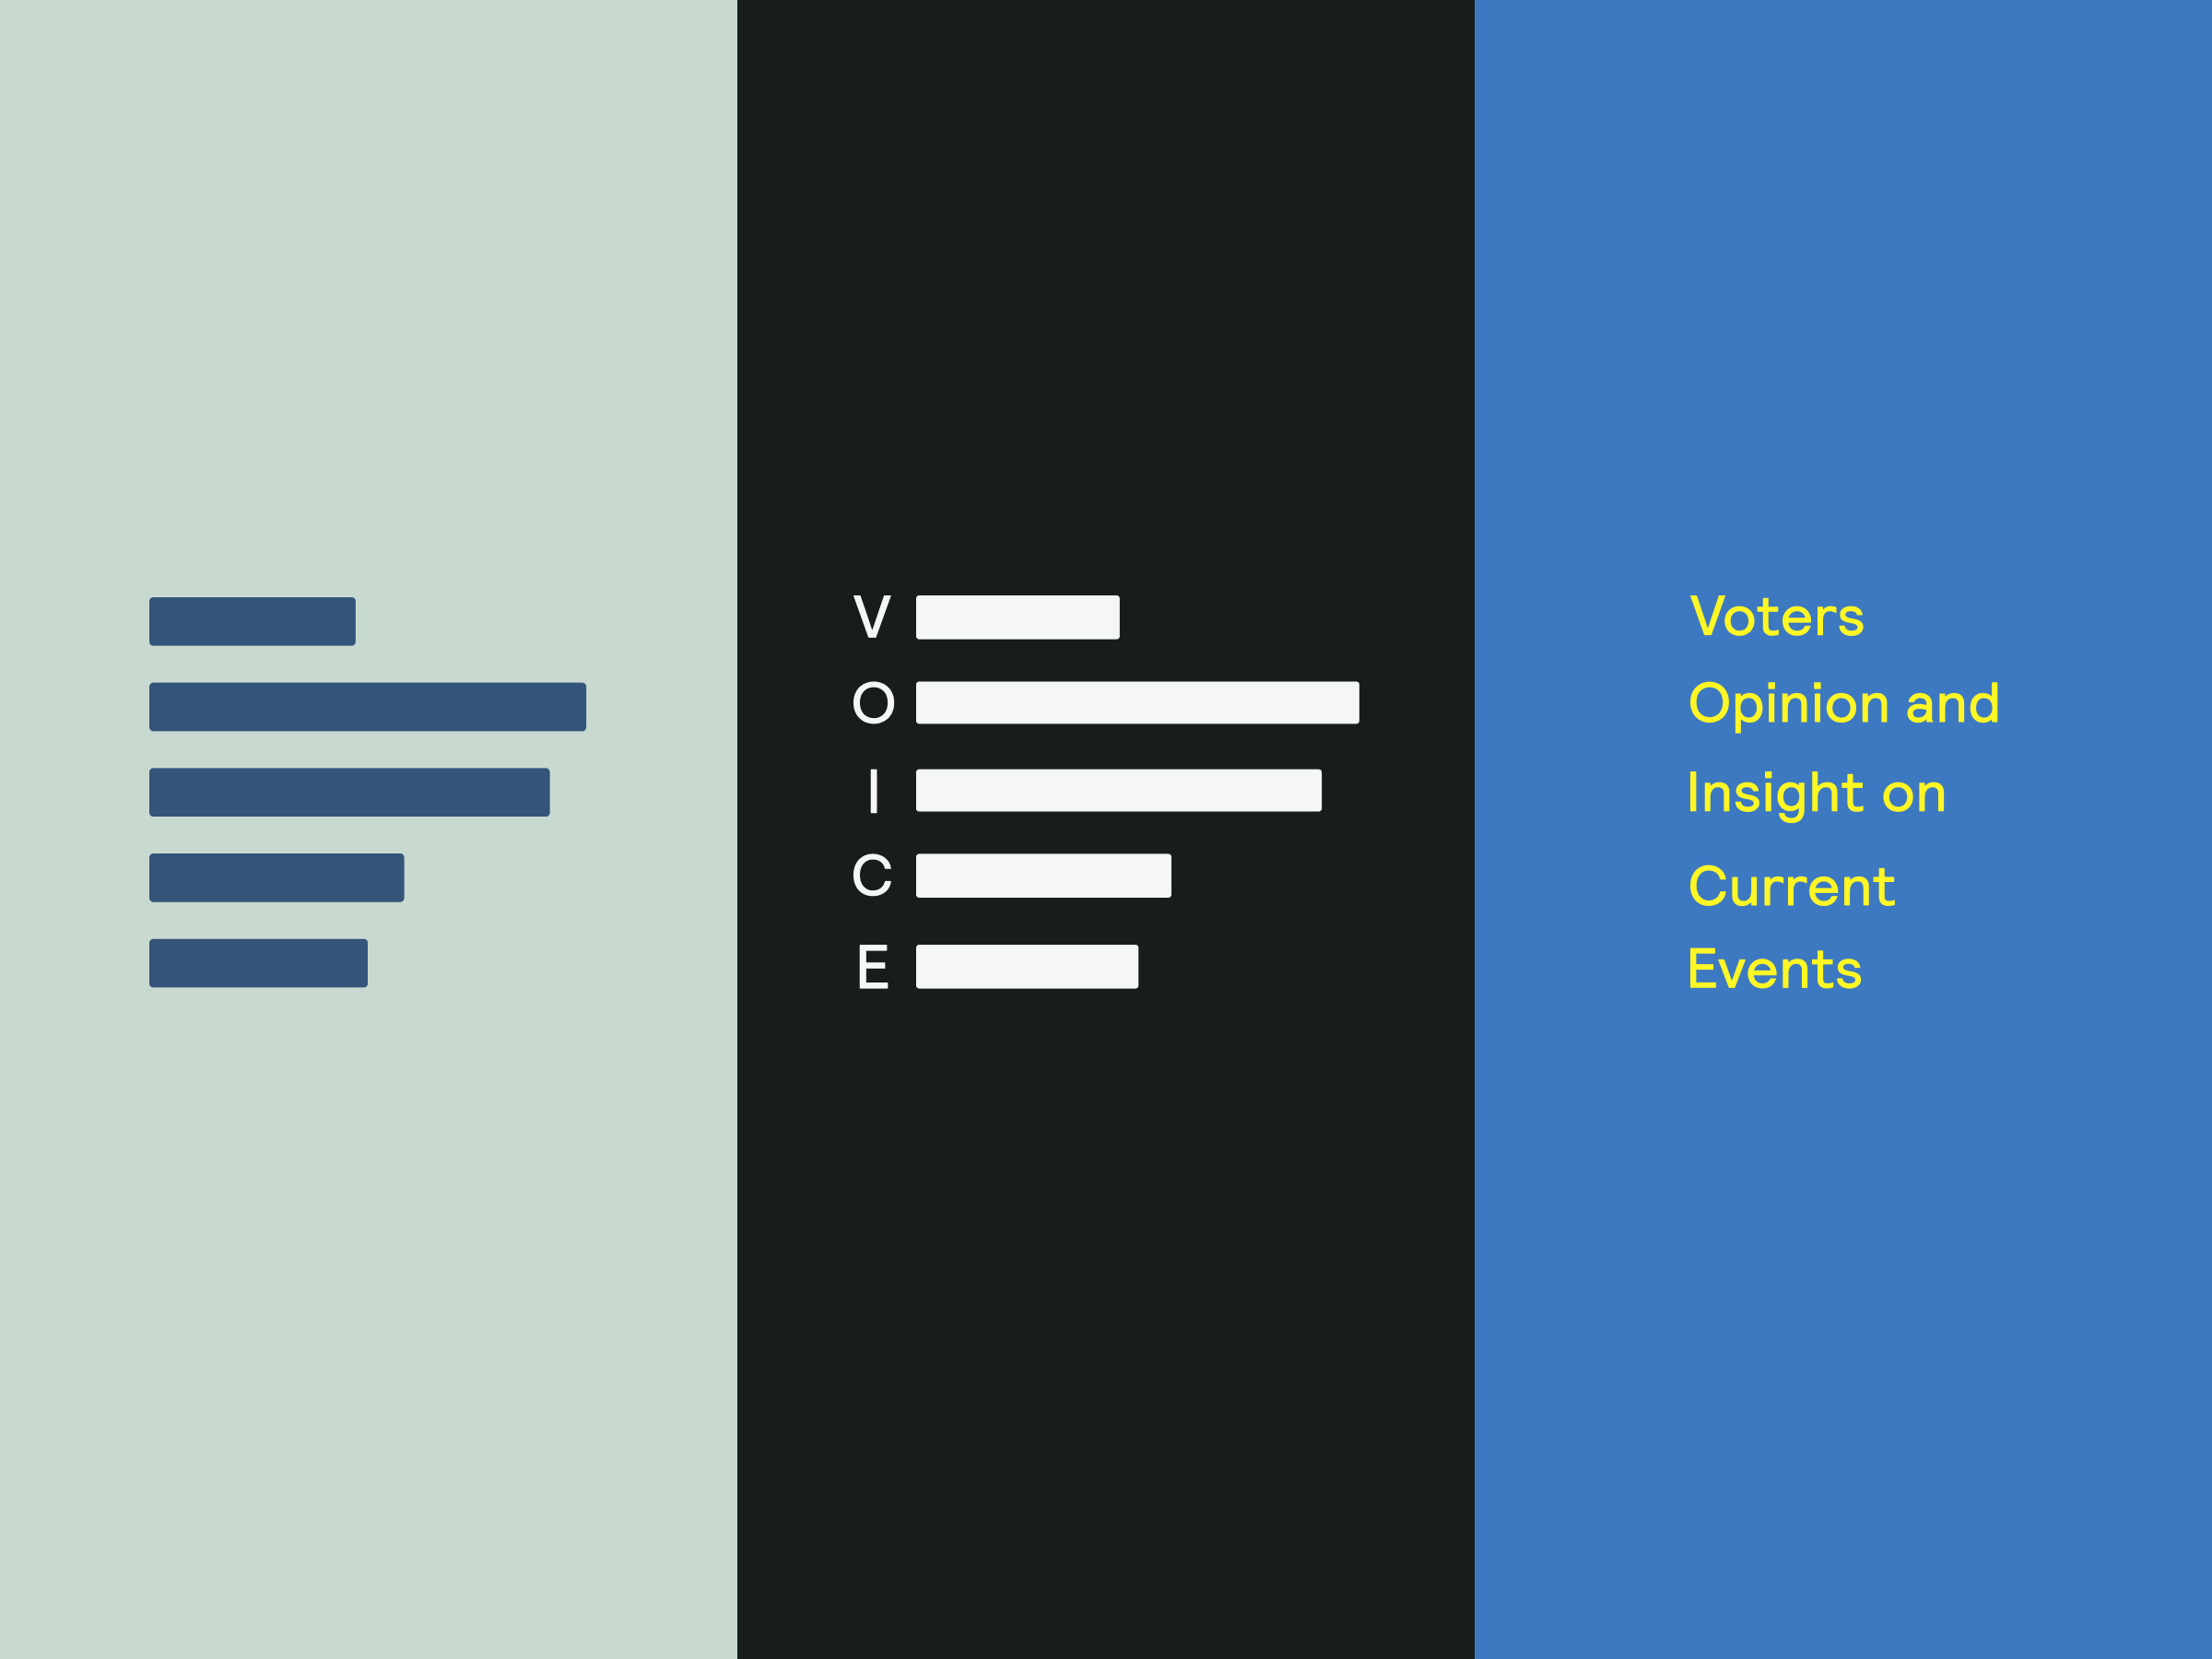
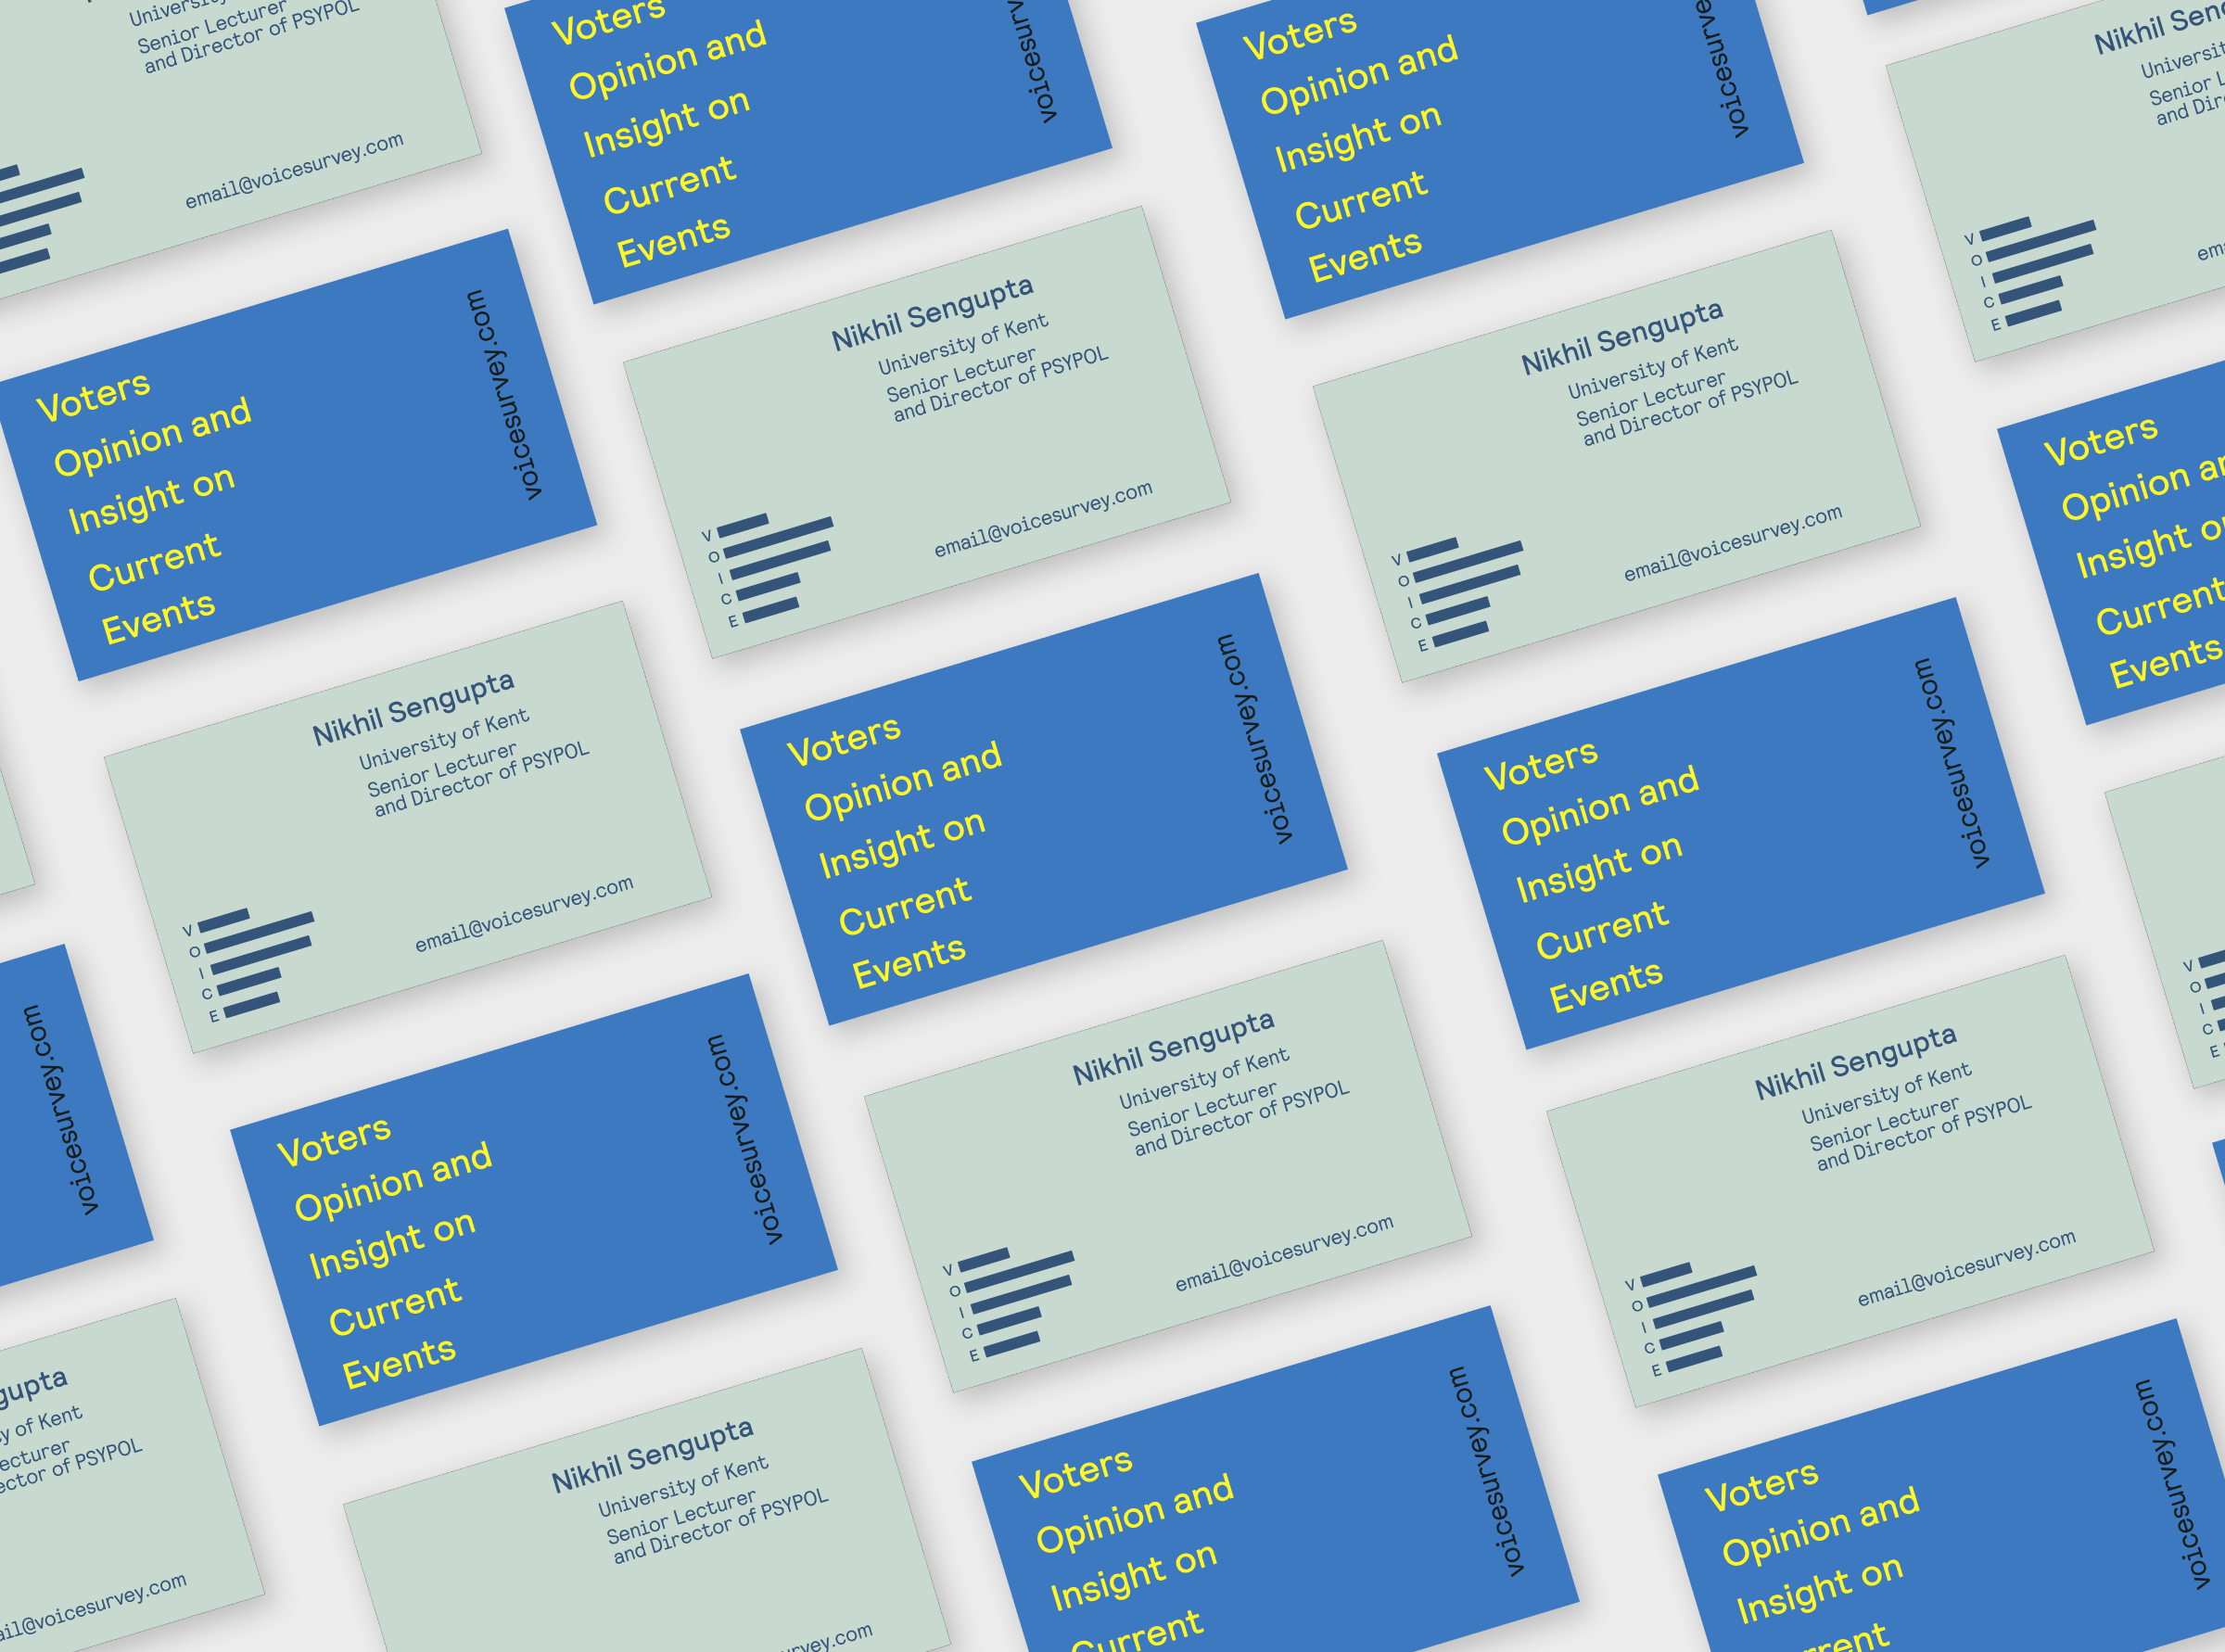
We took inspiration from data charts and infographics to create the VOICE logo. Symbolically, it nods to data presentation and data protection, with the full title blanked out, so it resembles a bar graph. Visually, the logo recalls abstract Modern minimalism, which has the kind of broad appeal and professionalism that we hope will pique the interest of people who are asked to complete the VOICE survey.
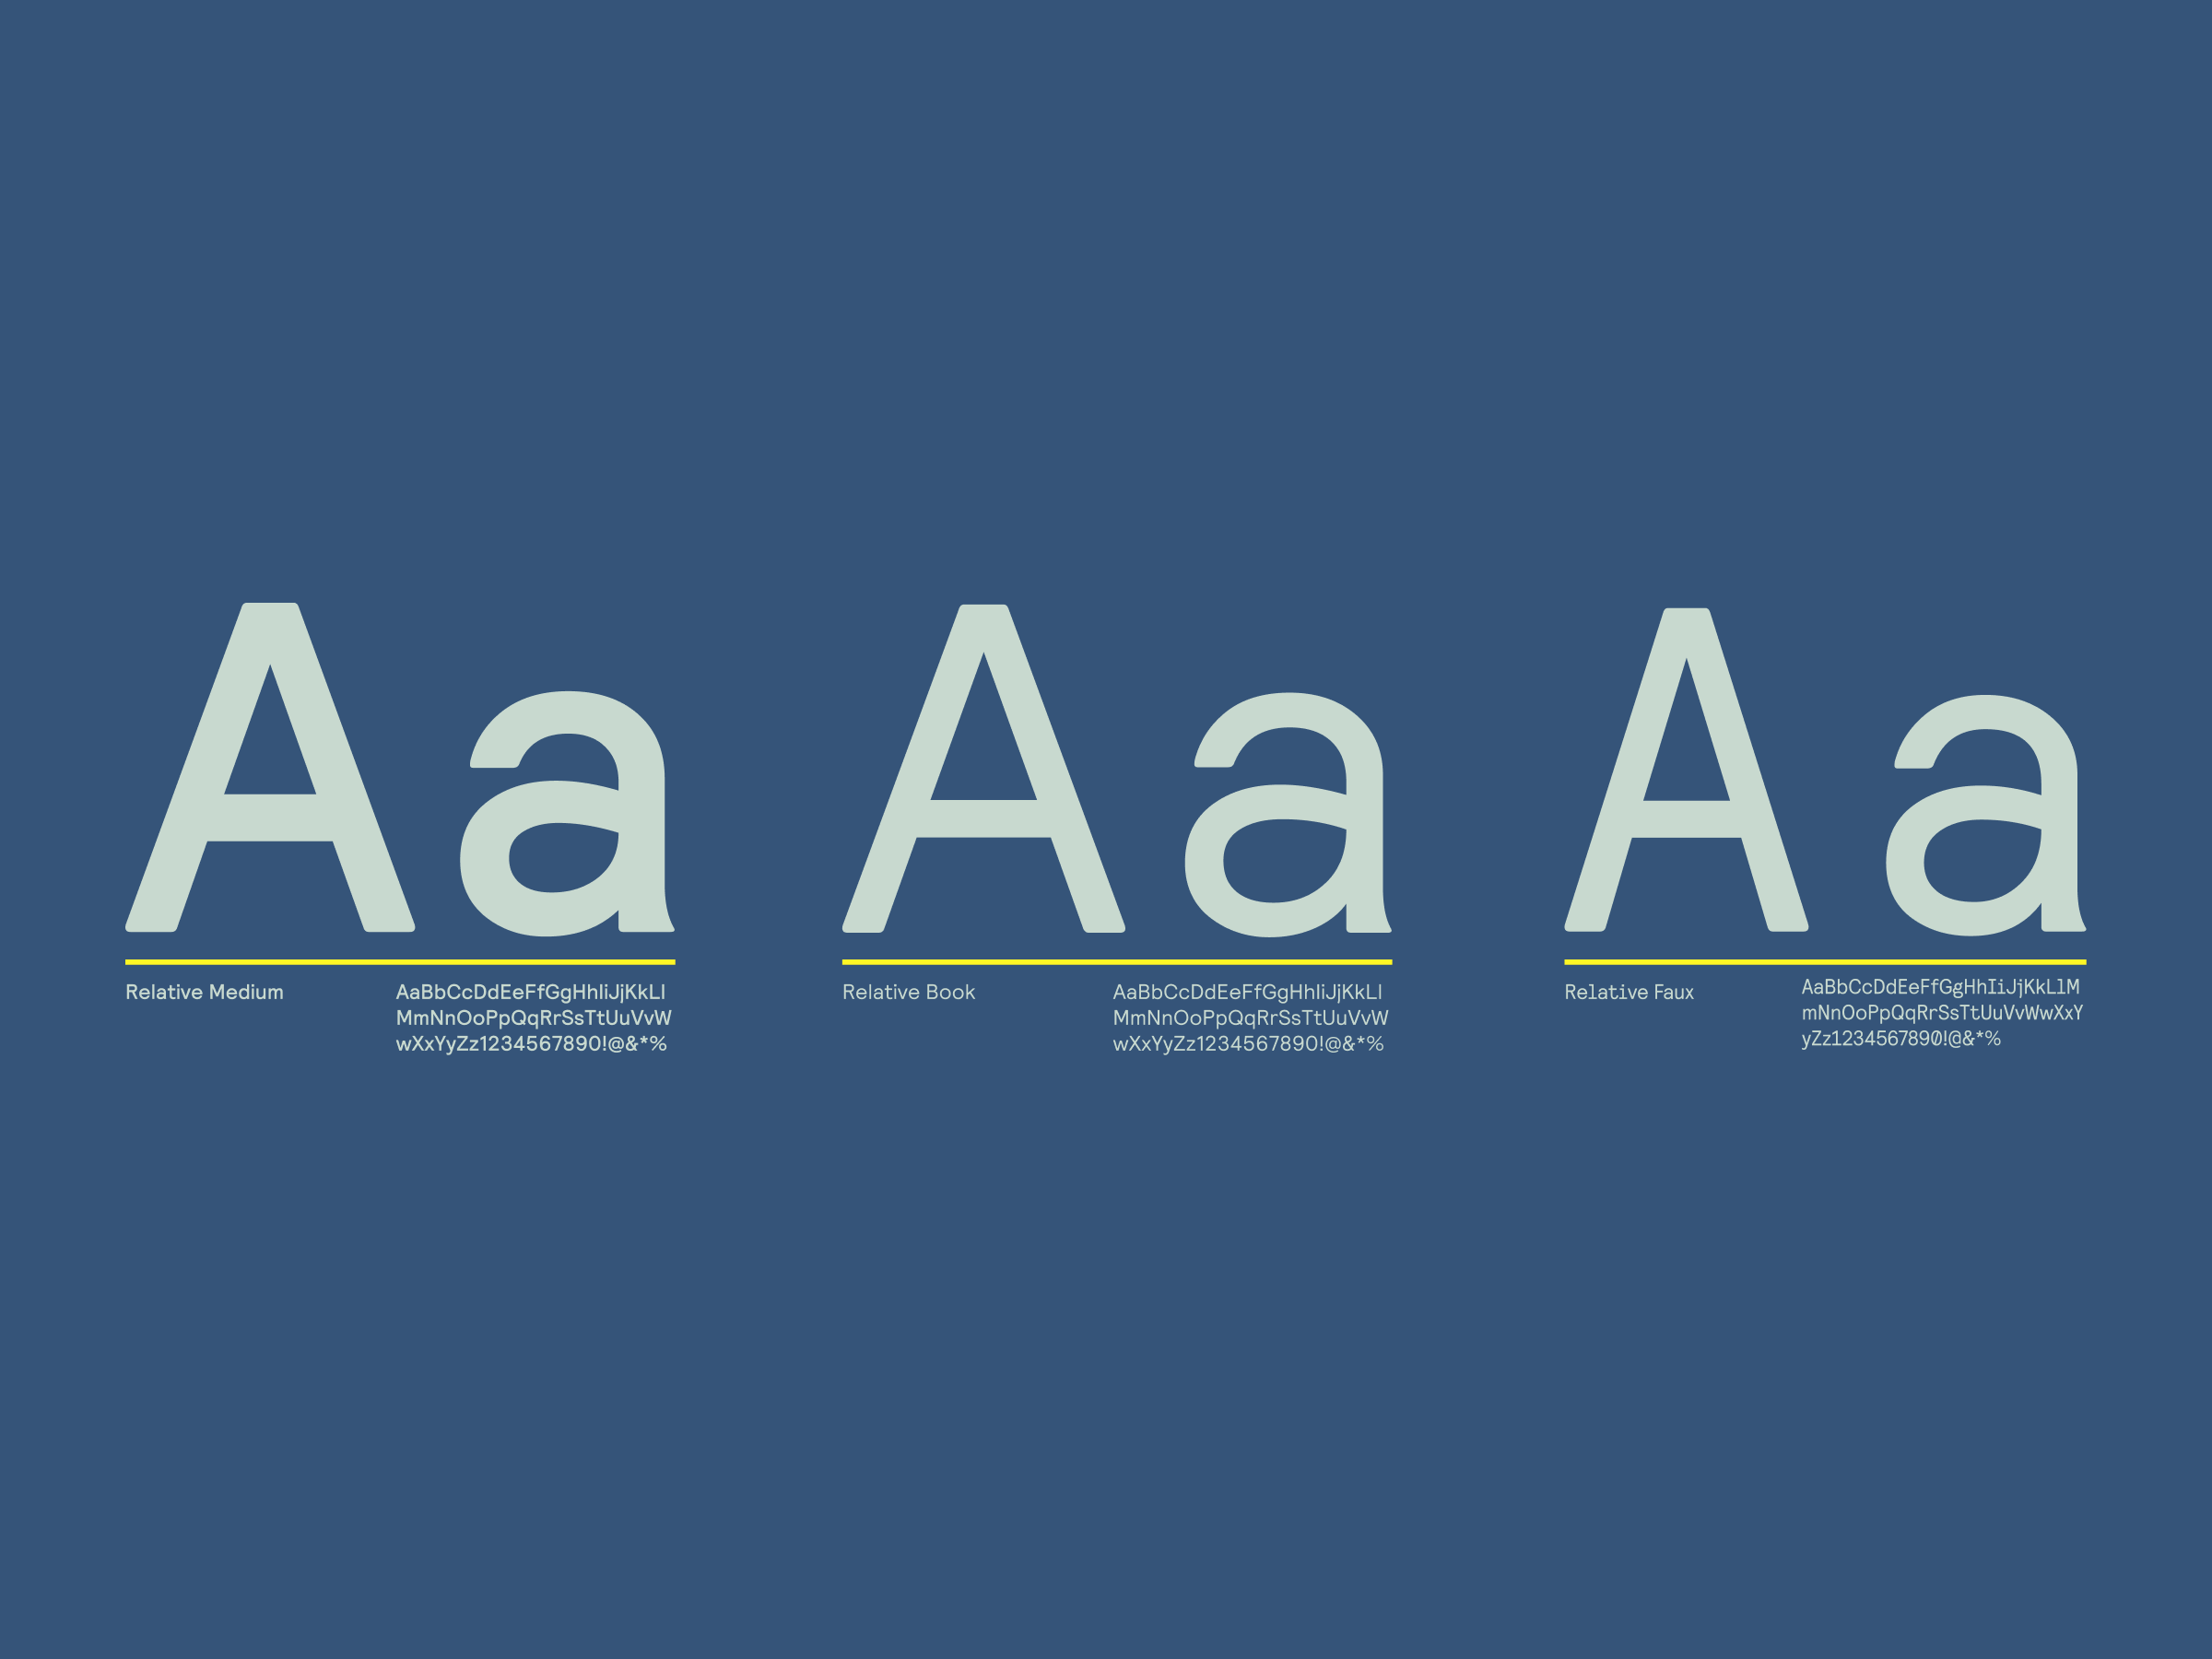
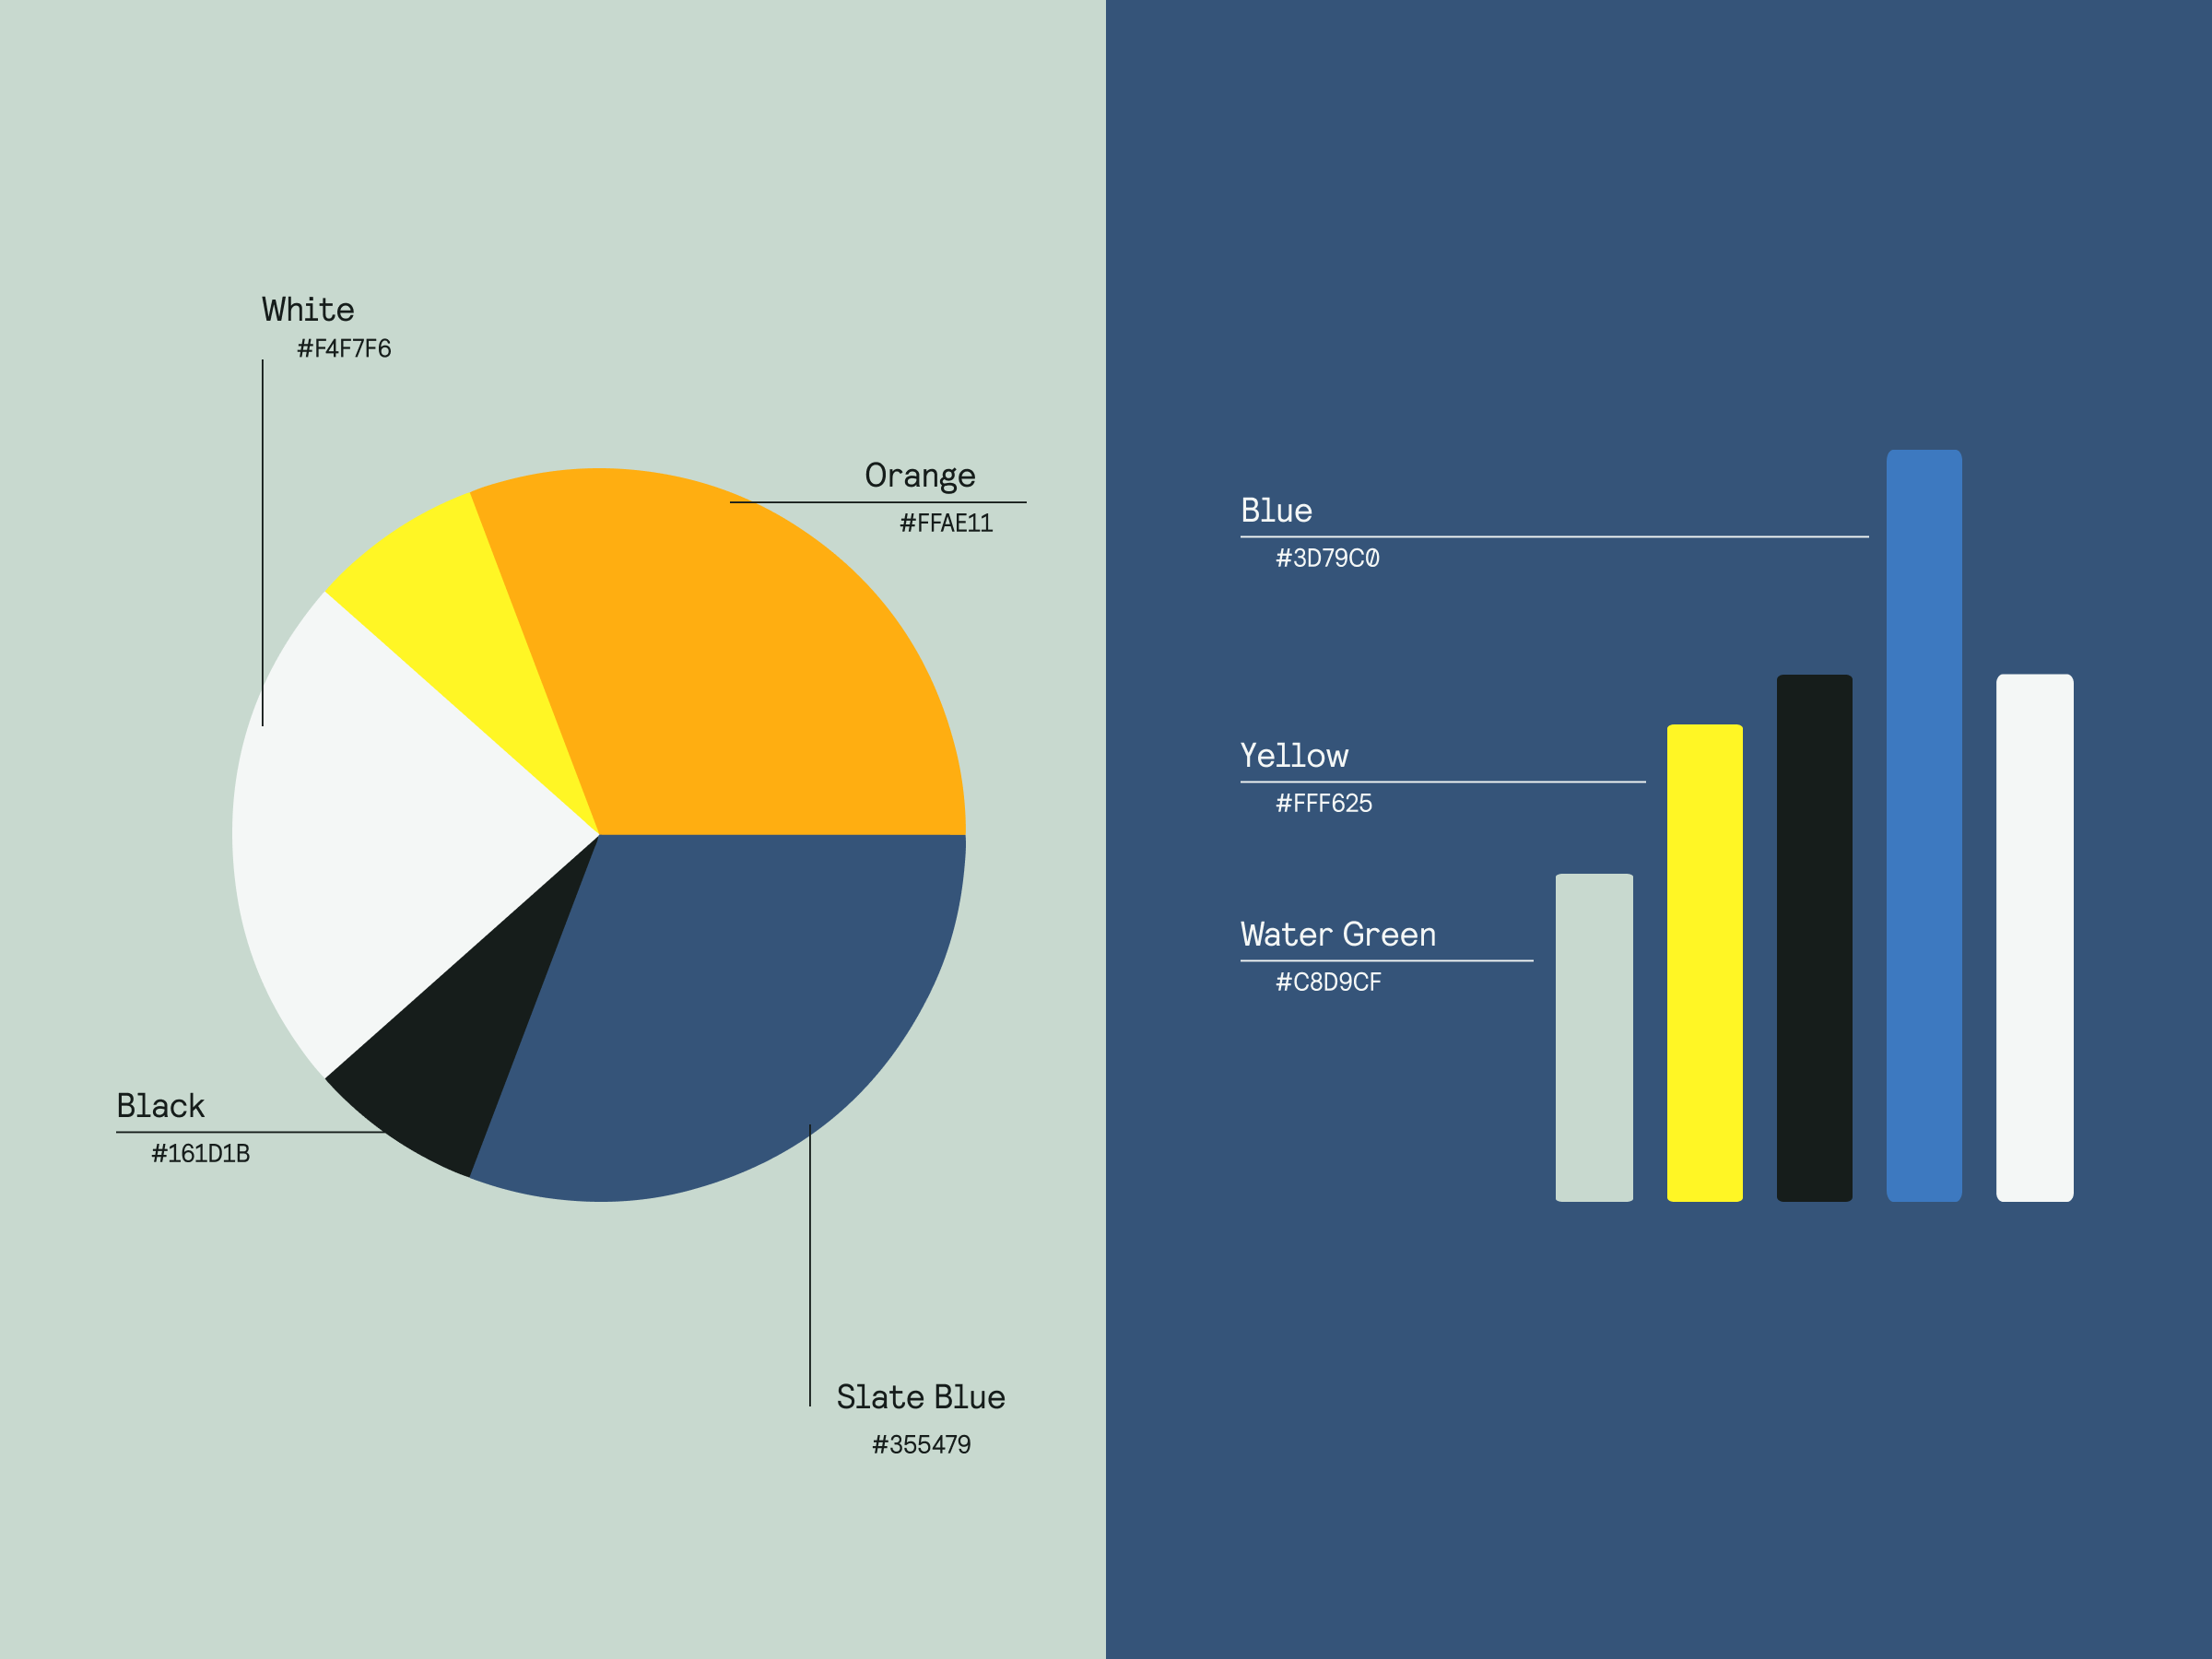
We selected easy-to-read sans serif fonts, for the purposes of engagement and accessibility, along with Relative Faux, which subtly recalls mid-century coding documents.The brand palette pairs colours associated with official documents and science, such as Slate Blue or Water Green, with the warmer Ochre Orange and Blood Orange, referencing the fact that VOICE is a reputable study but independent of government or any political party.
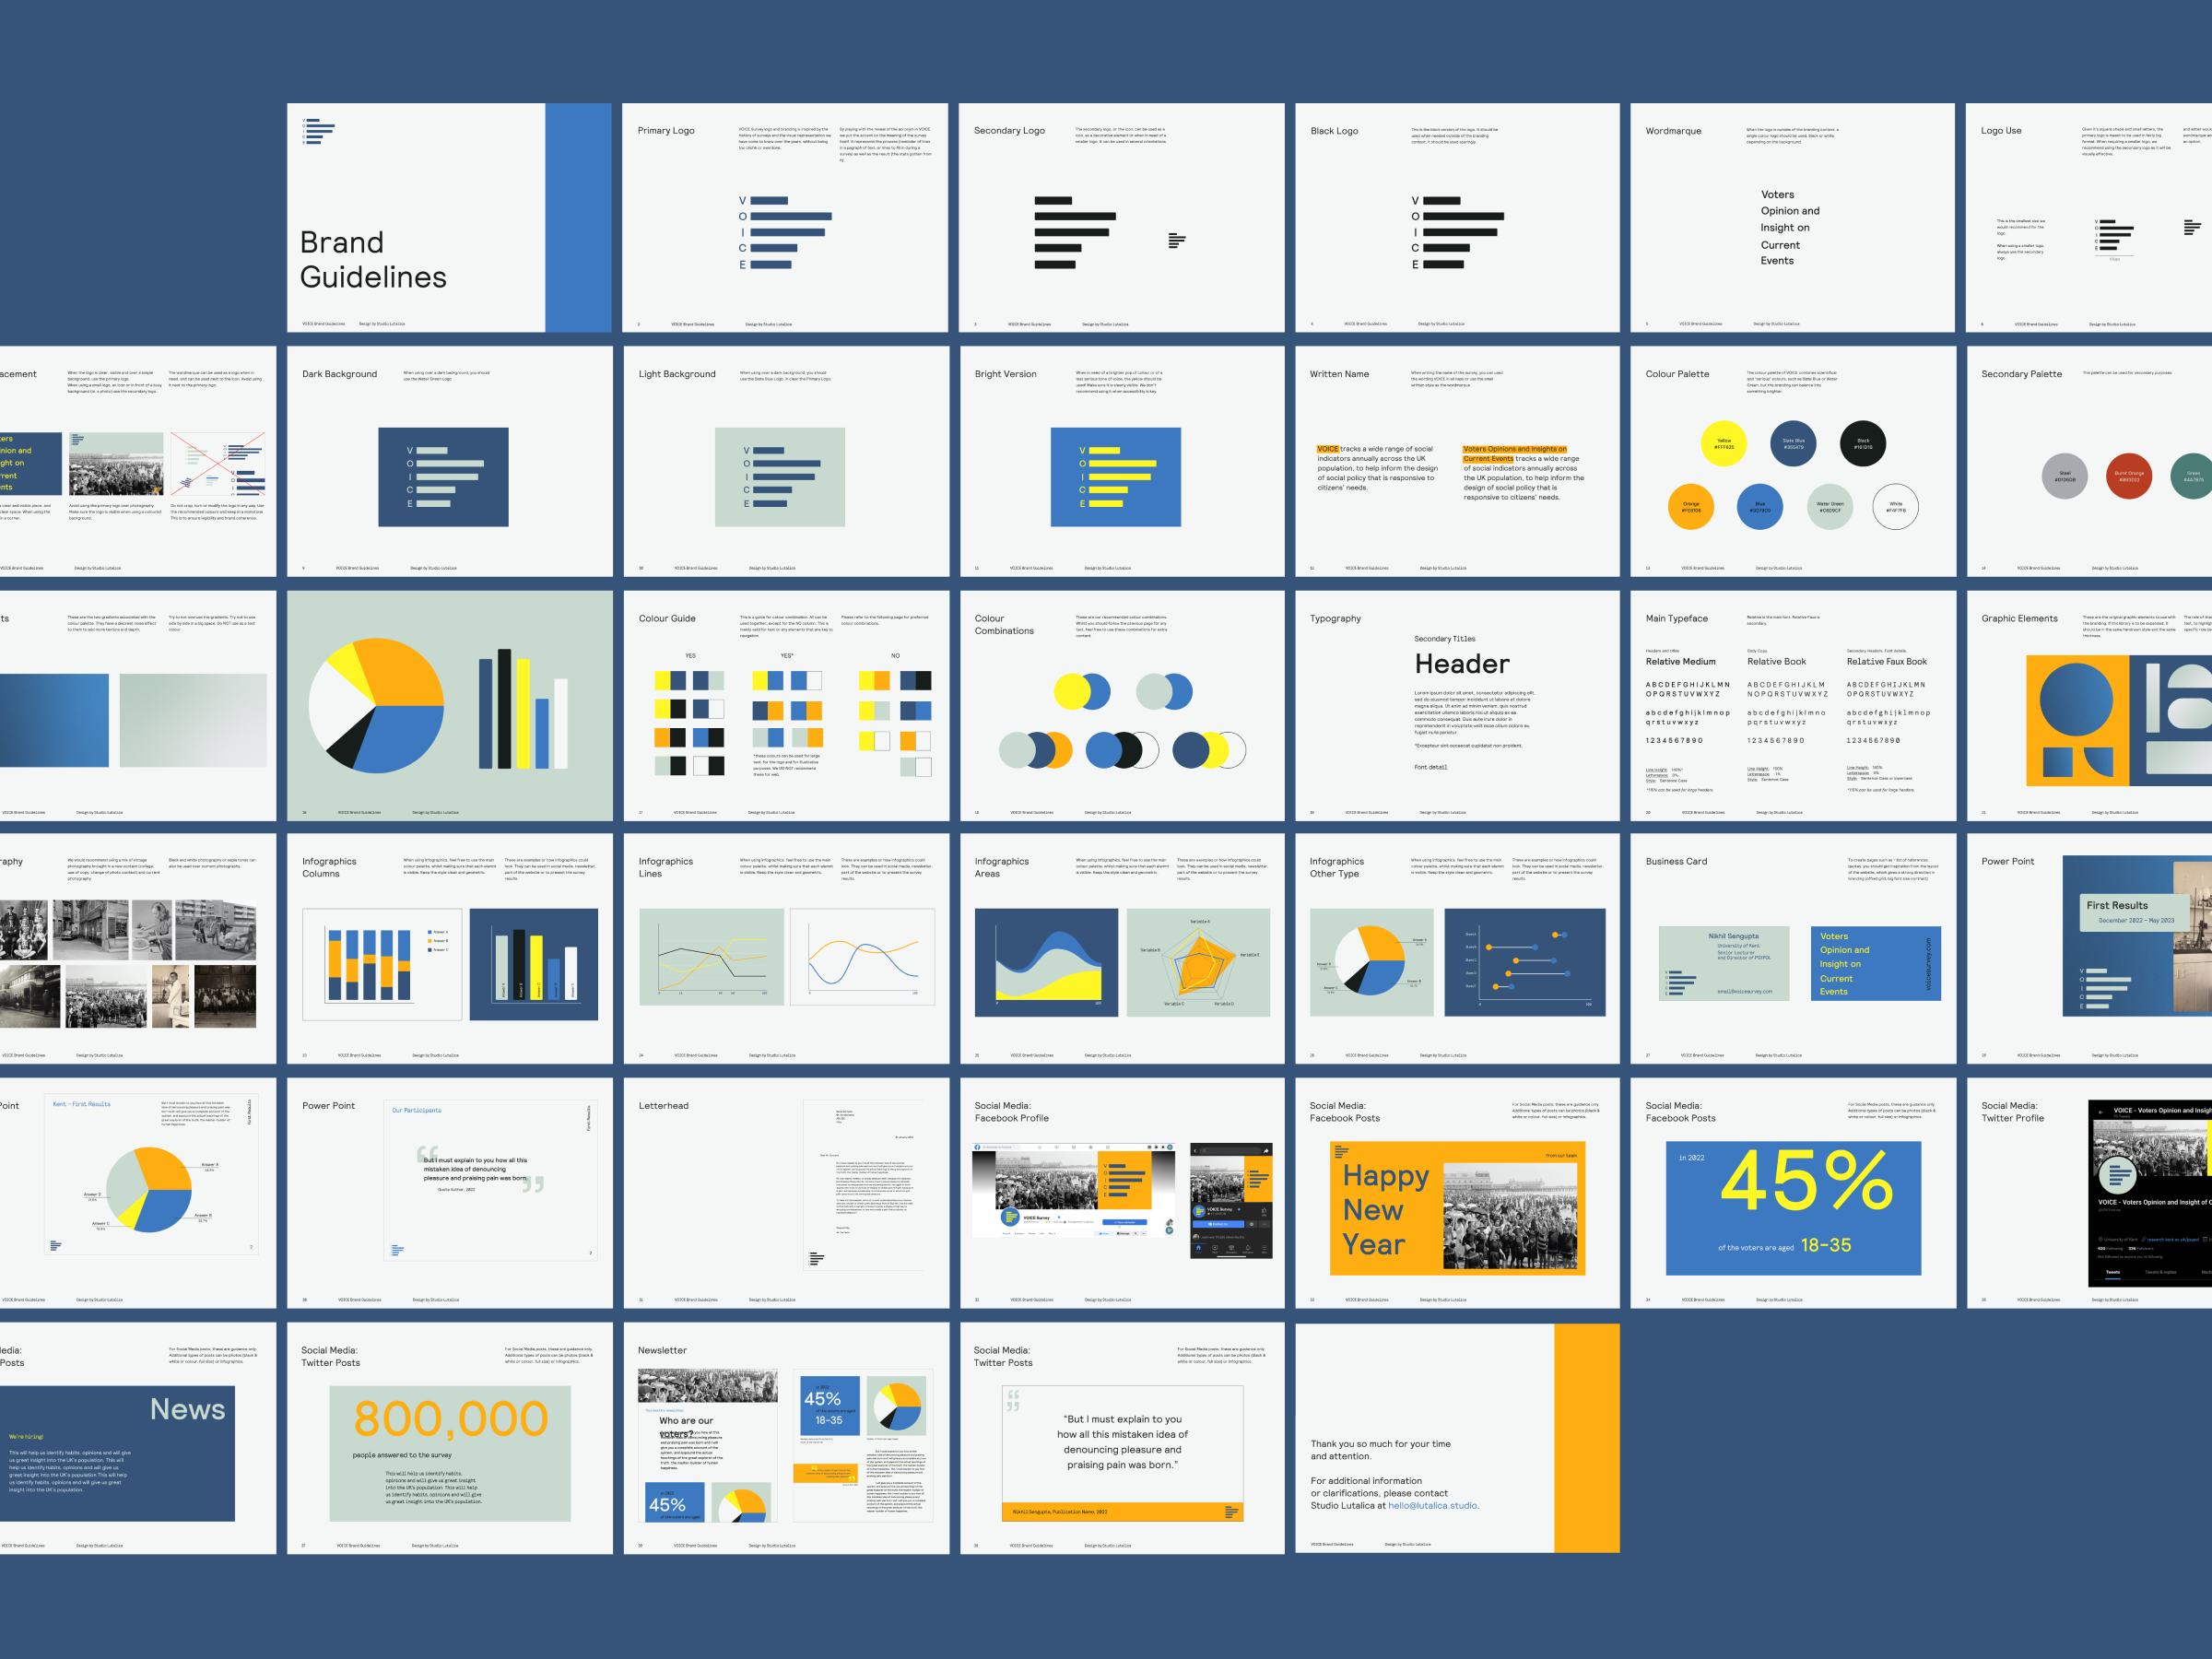
We always issue brand guidelines to clients, so they can apply their branding to documents beyond this project. As well as guidelines around how to use the Responsive Logo, fonts and colours, we also issued rulesets around imagery and graphic elements.
Data Visualisation
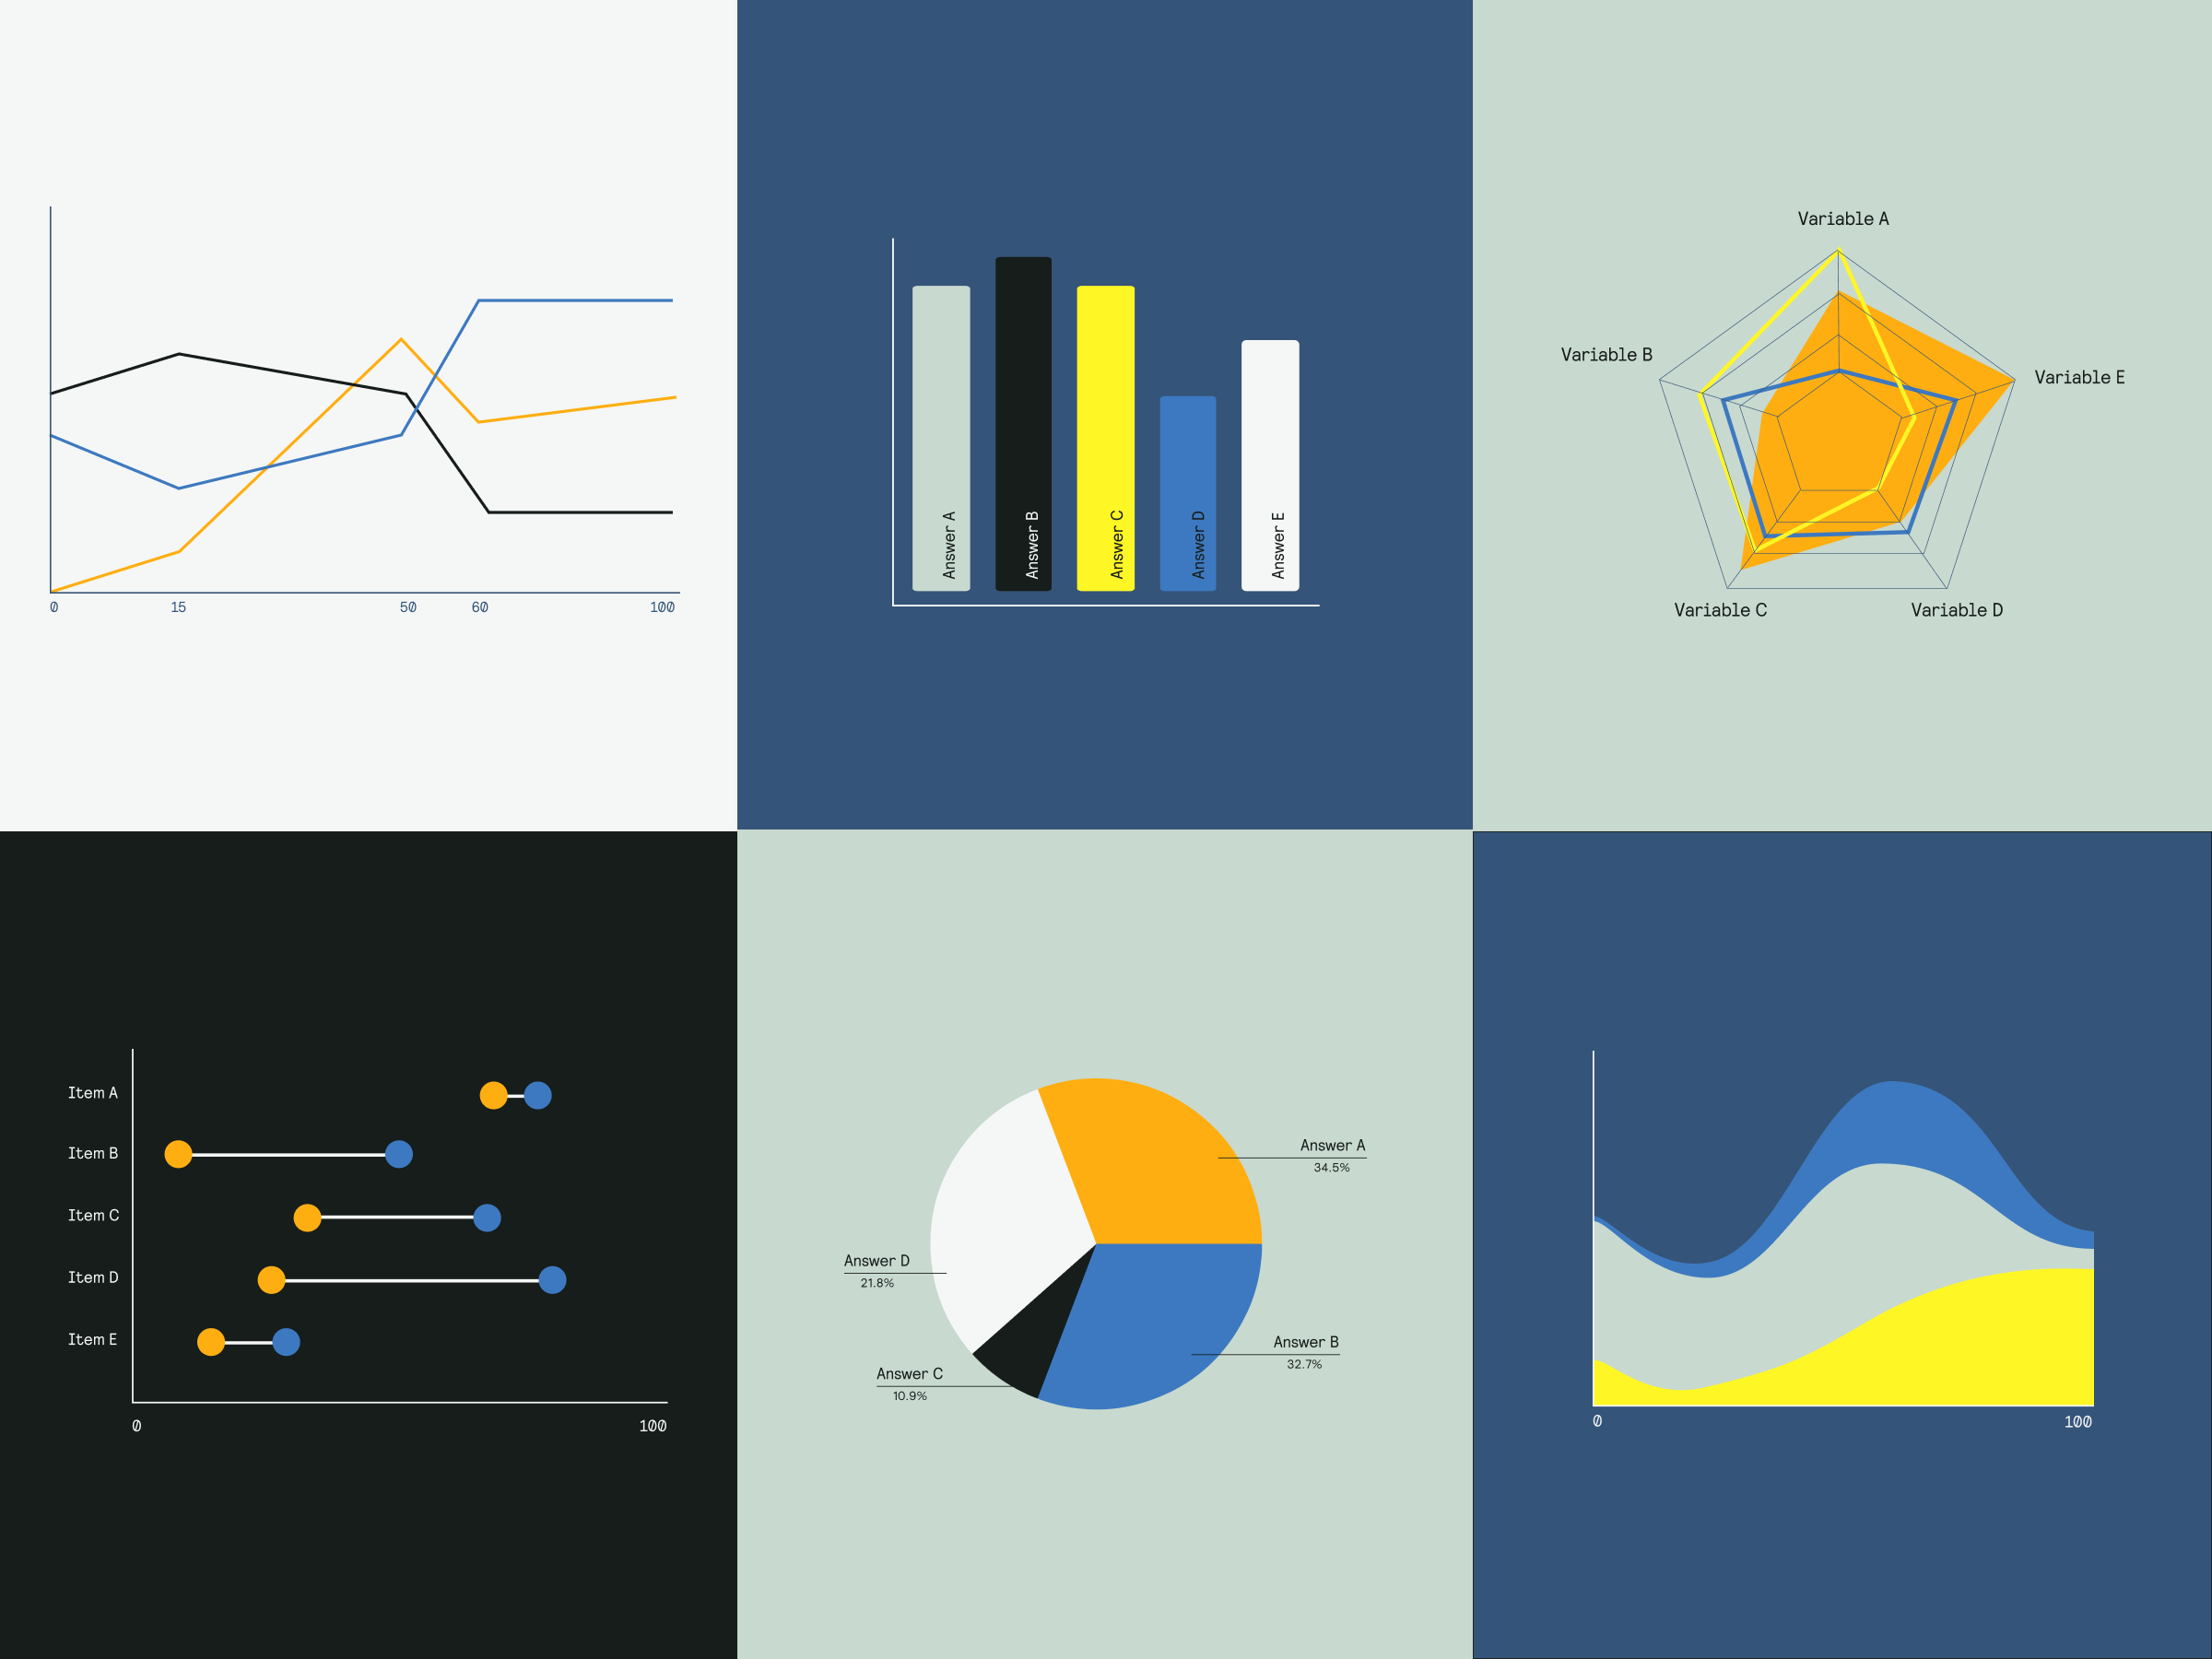
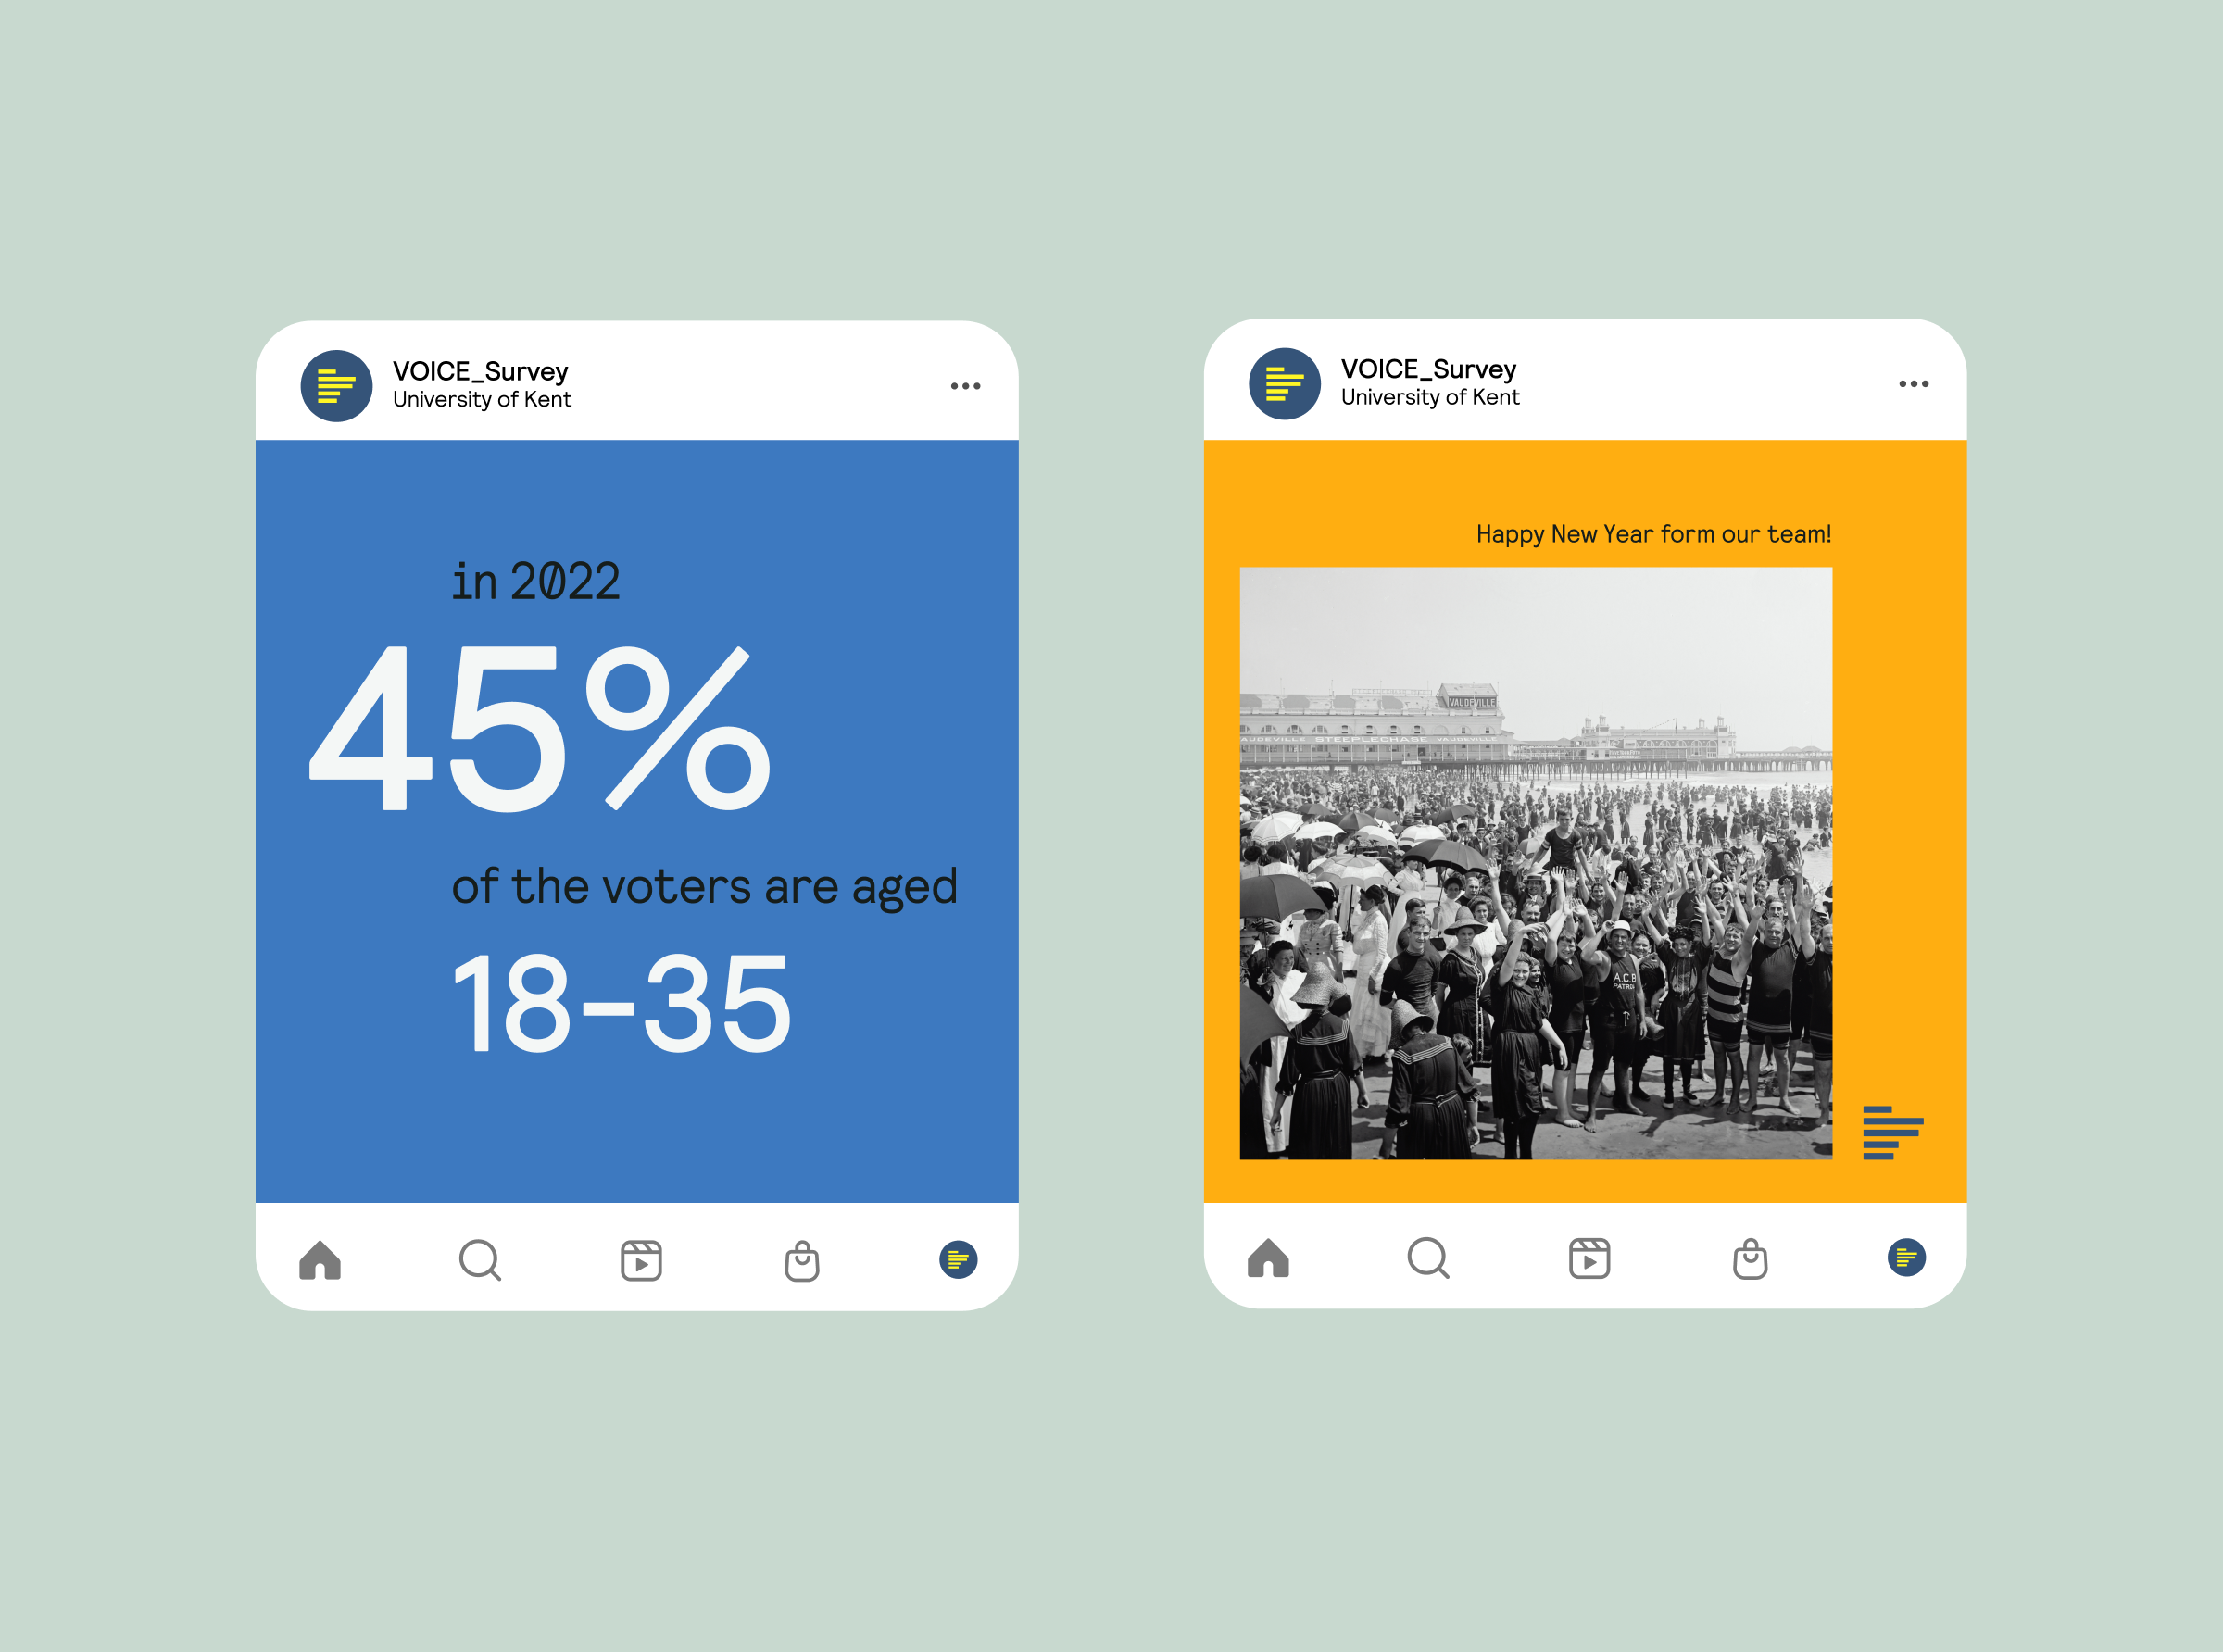
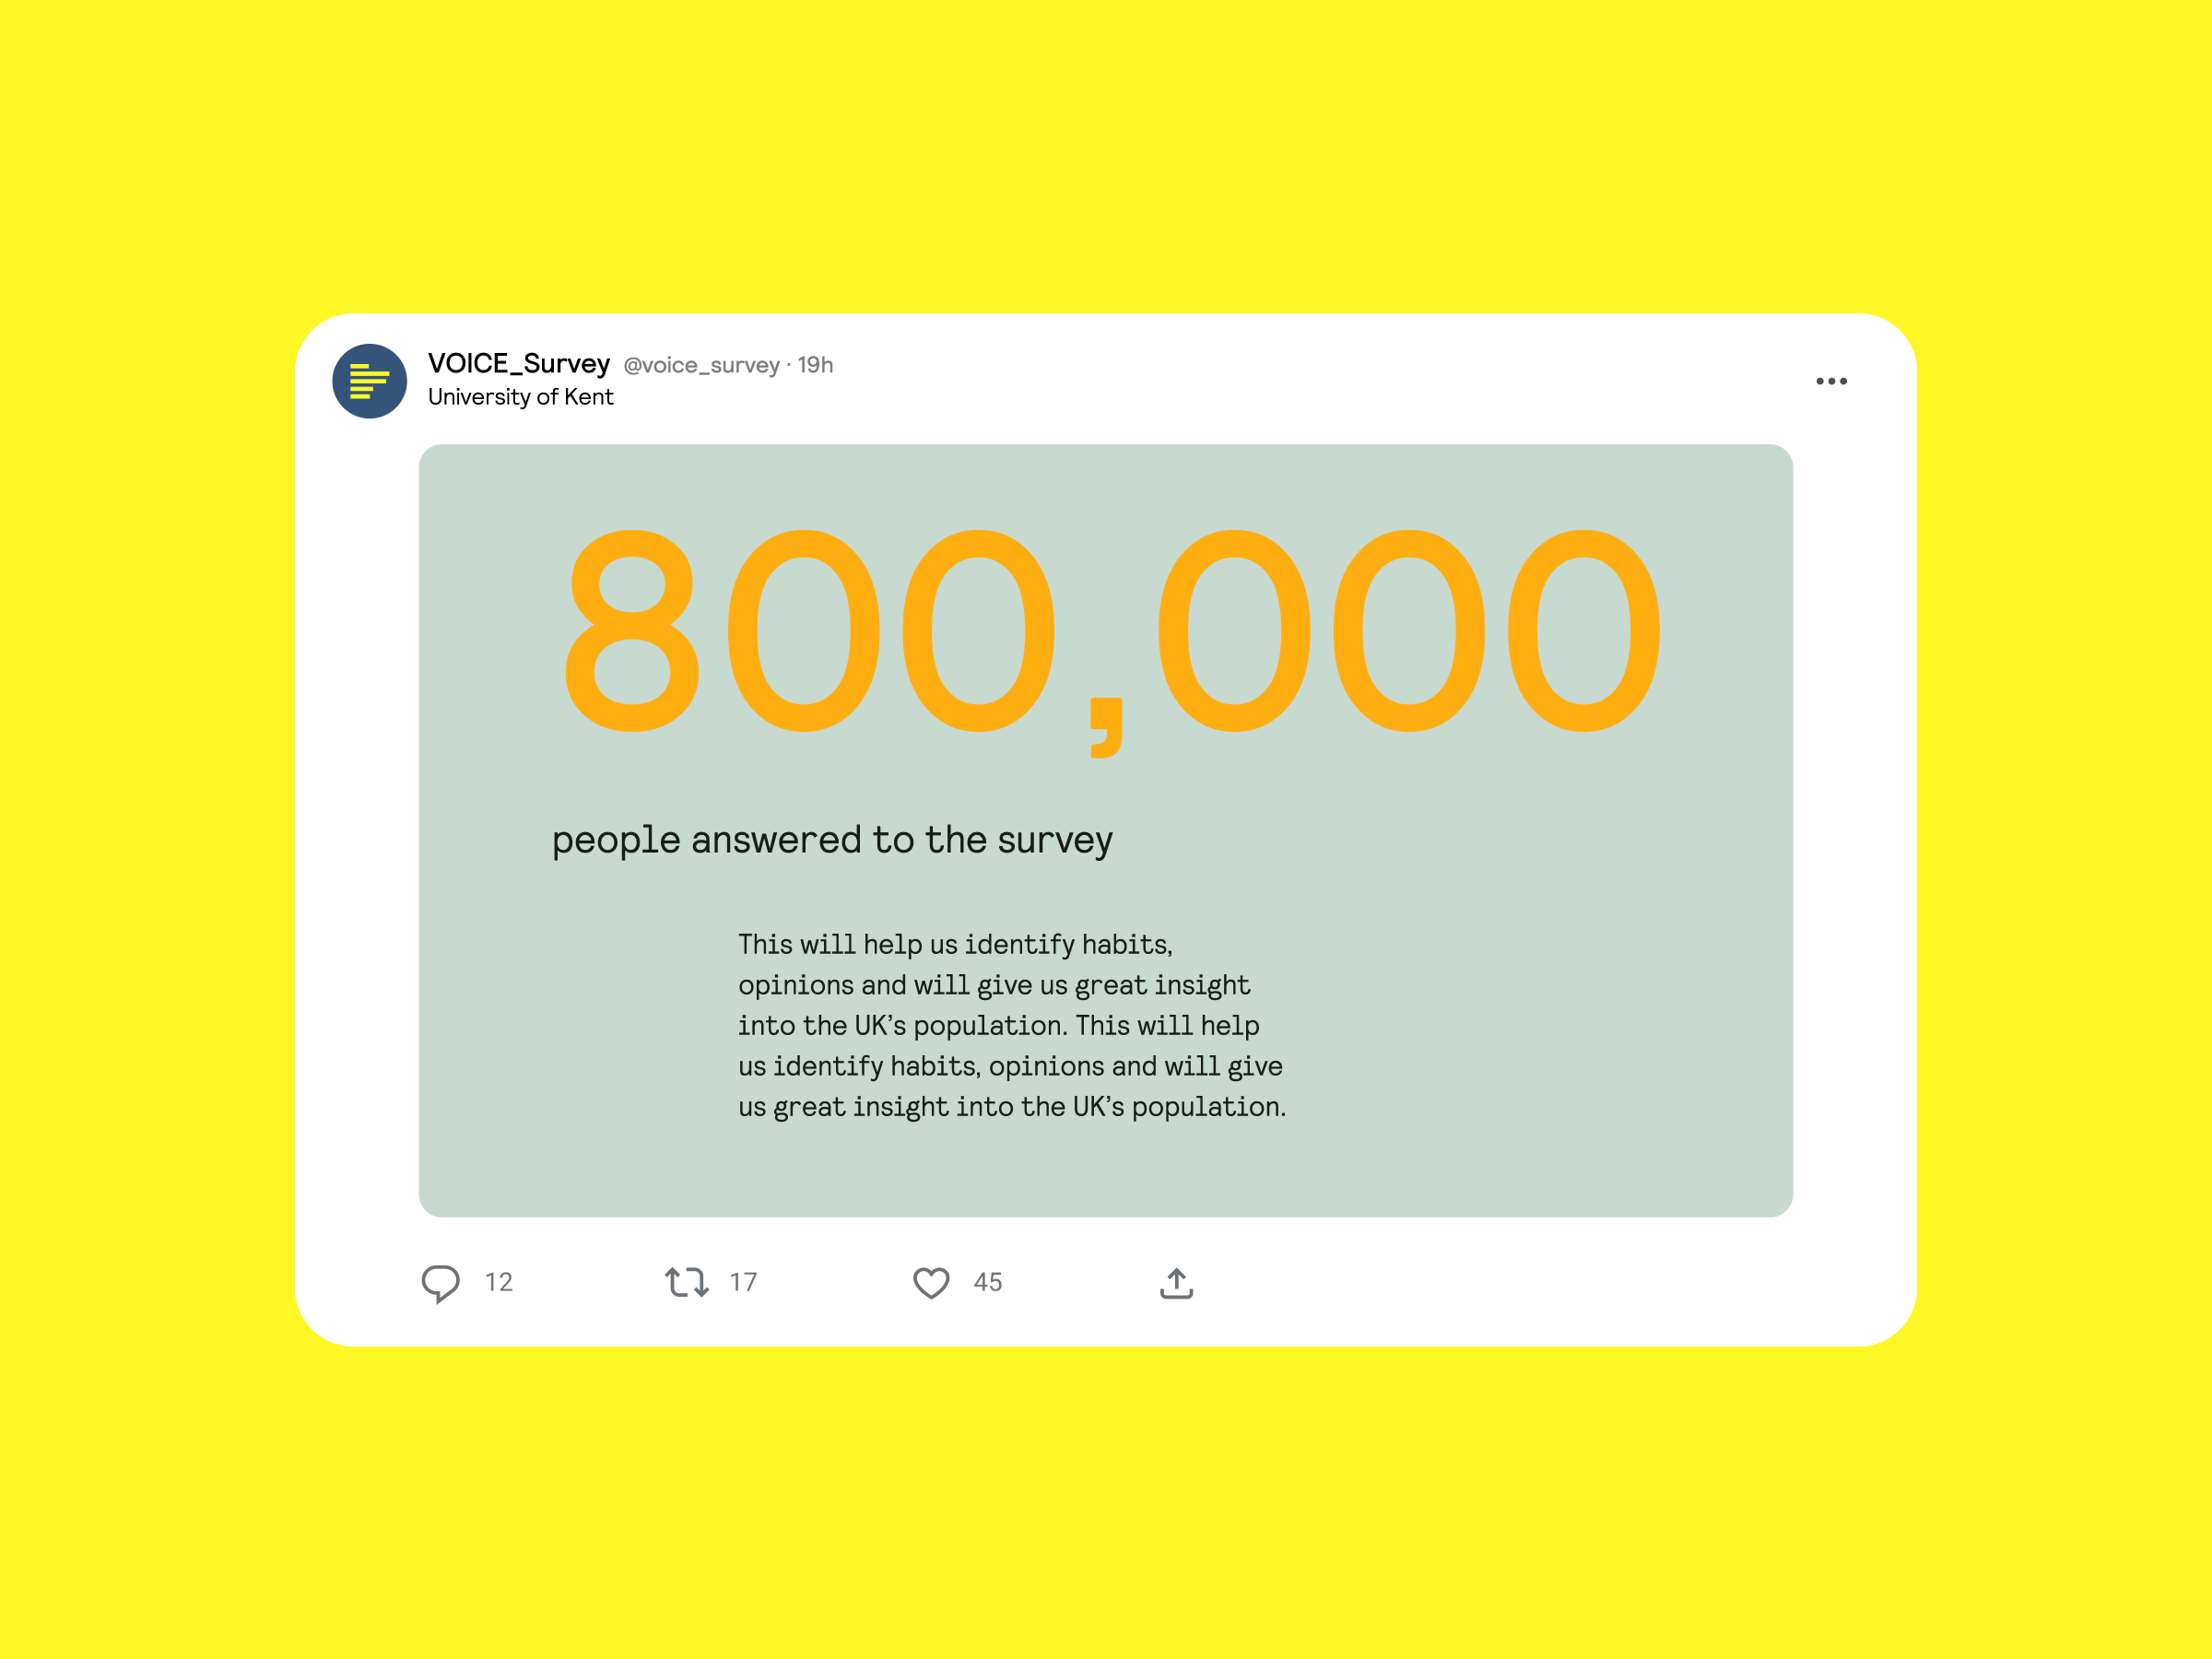
One of the incentives of being part of the VOICE survey is accessing the data that the project collects and seeing where you fit in a UK context. VOICE also intends to distribute its findings to policymakers, academics and a wider audience, so it was important for us to design engaging and accessible infographics, using the brand guidelines.
Collateral
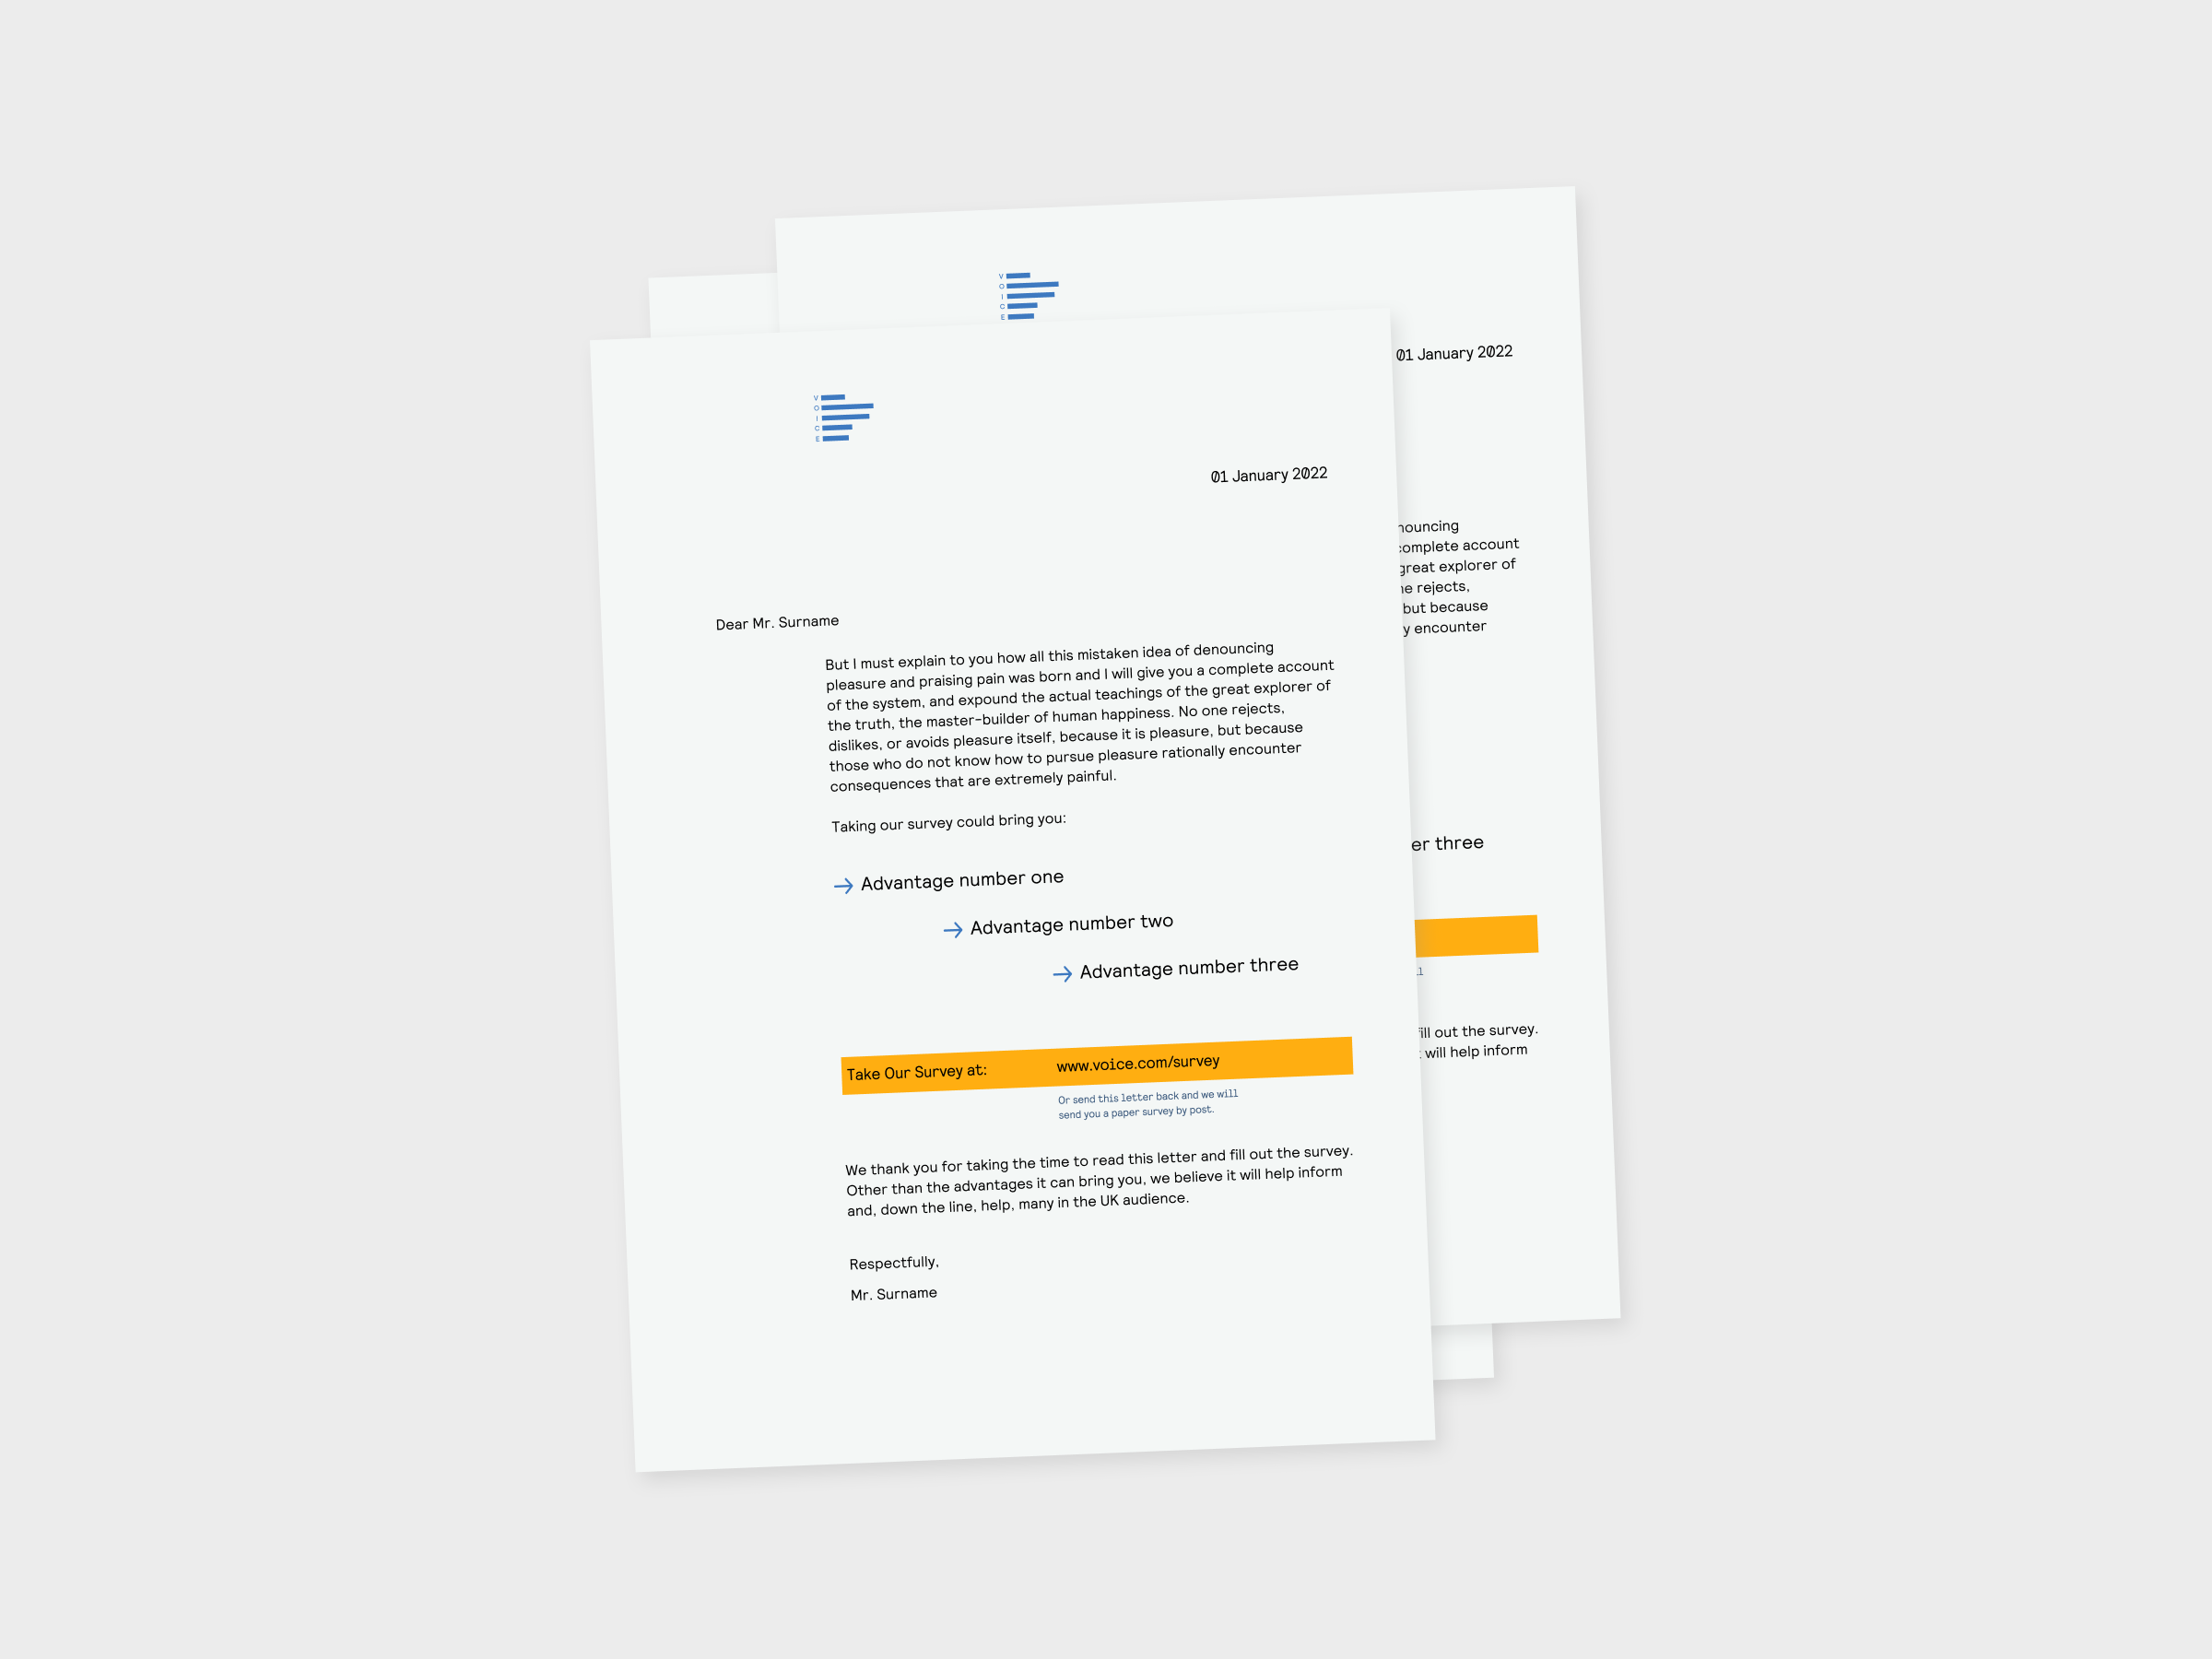
A key part of this project was promoting it on social media and sharing research findings via multiple channels. With this in mind, we created social media templates, flyers, printed inserts, and presentation templates.